Examples of Clear visual messages of Financial data
In this section of my site I share examples of data visualization applied to reporting financial messages. Too often financial results or analysis are reported using spreadsheets or paragraphs of text. Below I share examples of how those in accounting, finance, treasury, and other areas can use visuals to effectively communicate important messages.
I’ve organized the examples by the message they communicate because I believe that the correct visual is based on the message, not on how nice it looks. I have organized the examples into nine categories of messages based on my years of working with financial professionals and the messages they communicate. If you’d like to see some examples organized by messages common to financial statements, check out my articles for Income/P&L, Balance Sheet, and Cash Flow Statement.
The examples are drawn from my work with clients in customized workshops, from visuals published in the media, and from public financial statements such as annual reports. Some of the examples are makeovers where I show a visual that can replace a spreadsheet or table of numbers, some are examples of improving on a visual, and some are commentary on aspects of a visual that we can learn from and apply in our own work. In most cases I have added some tips on how to create the visual in common Office programs such as Excel and PowerPoint.
You can apply these lessons in areas such as regular financial reporting to others, preparing financial statements to be published, and creating dashboards in big data analysis tools such as Power BI or Tableau. Scroll through the nine areas below and review those examples that apply to the messages you need to communicate. If you want to see the latest examples from all categories, click here.
If you want to learn how to create visuals like the ones you see in the examples, I offer customized hands-on workshops as well.


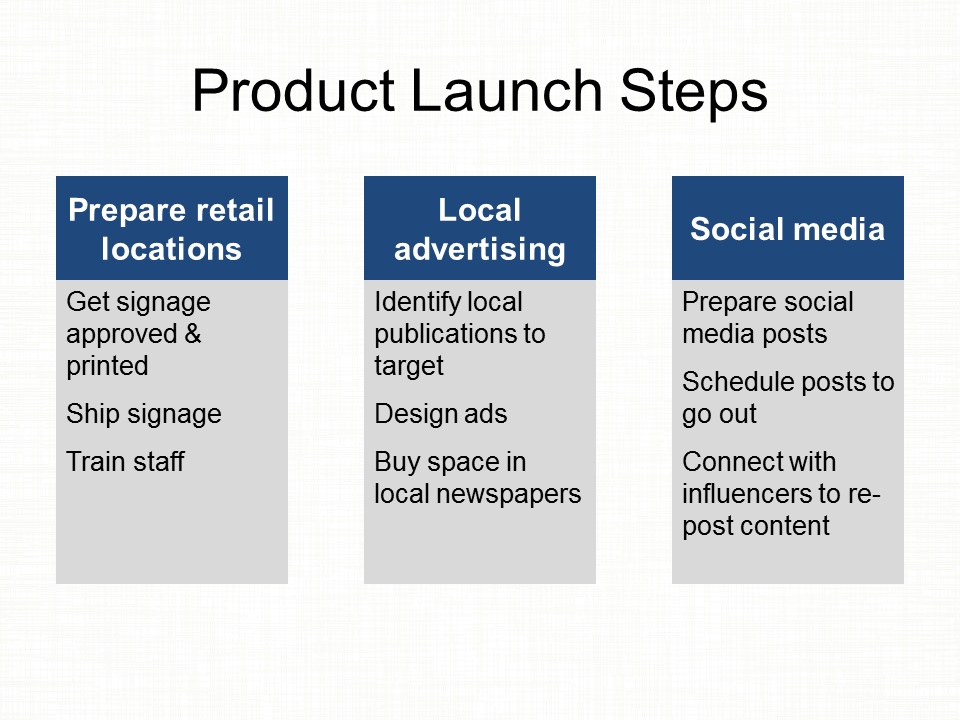
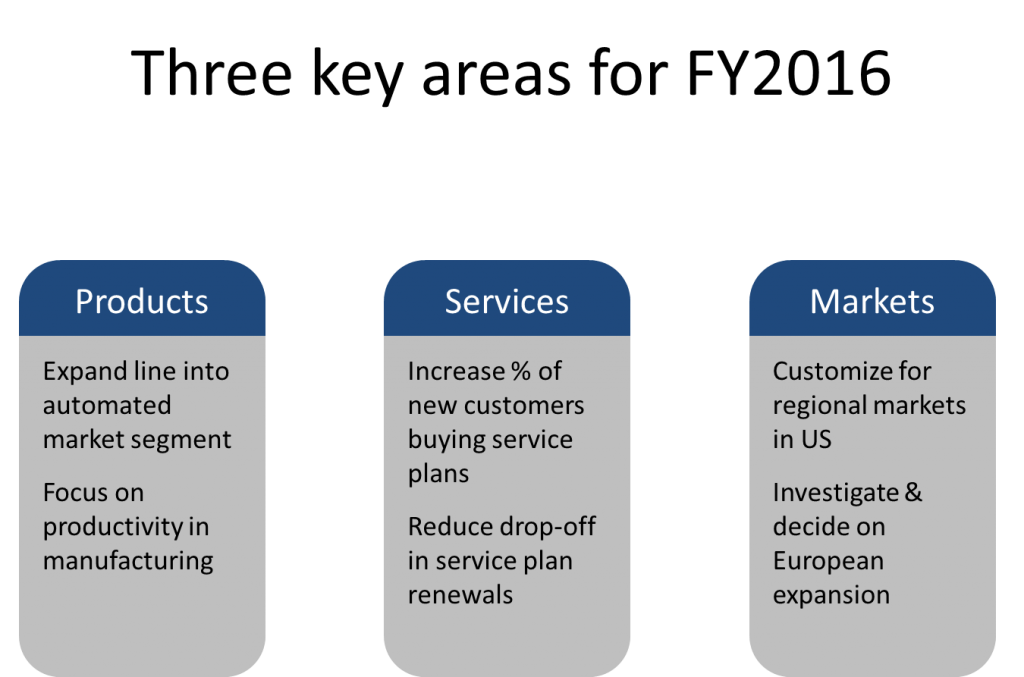
Group of text points (view all)