Online Courses
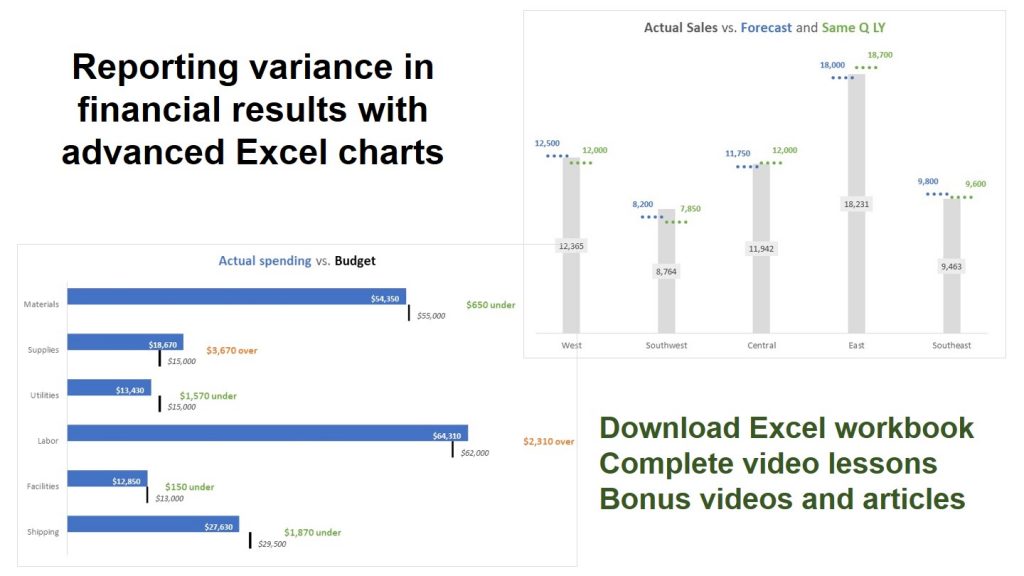
Reporting variance in financial results with advanced Excel charts
Get a downloadable template and complete instructions on how to create six visuals in Excel that communicate variance between actual results and budget, forecast, or last year.
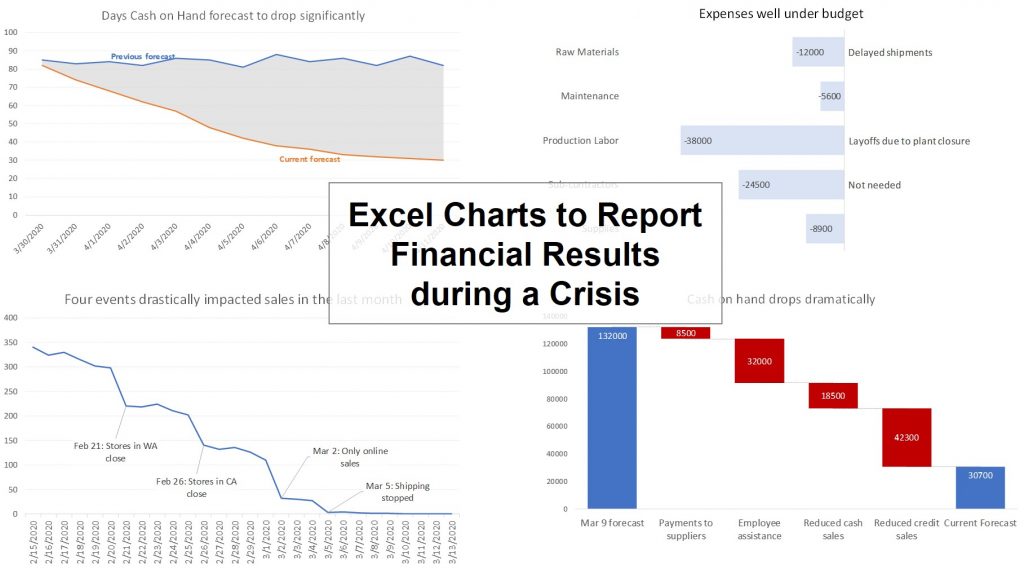
Excel Charts to Report Financial Results during a Crisis
Get a downloadable template and complete instructions on how to create visuals in Excel that communicate critical financial metrics in a crisis.
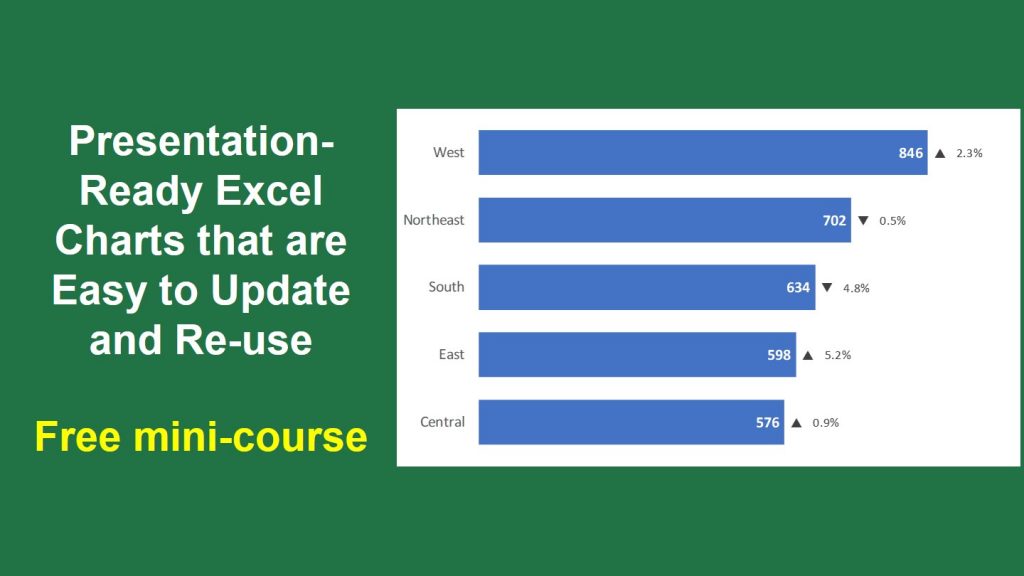
Presentation-Ready Excel Charts that are Easy to Update and Re-use
Spend less time creating and updating Excel charts for business presentations with these practical tips.
Running a Charity Auction on Zoom free mini-course
Run an online auction to raise money for your charity using only PowerPoint and Zoom.
Videos
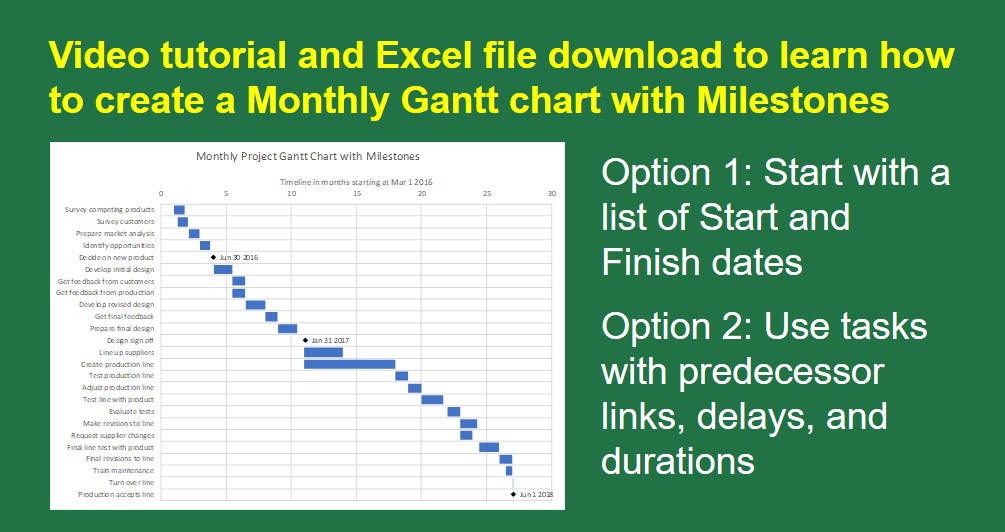
Video tutorial and Excel file to create a monthly Gantt chart
Download the video tutorial and Excel file and start creating Gantt charts today!
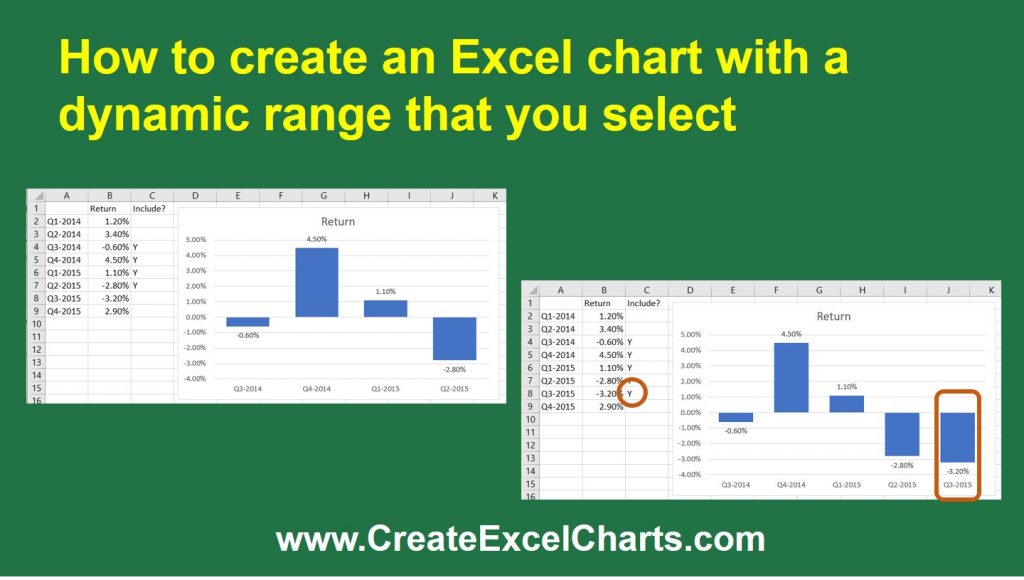
Dynamic Selected Range Excel Chart Tutorial Video, Sample File & Article PDF
Indicate the data you want used for a chart and have the chart automatically update when you change your mind.
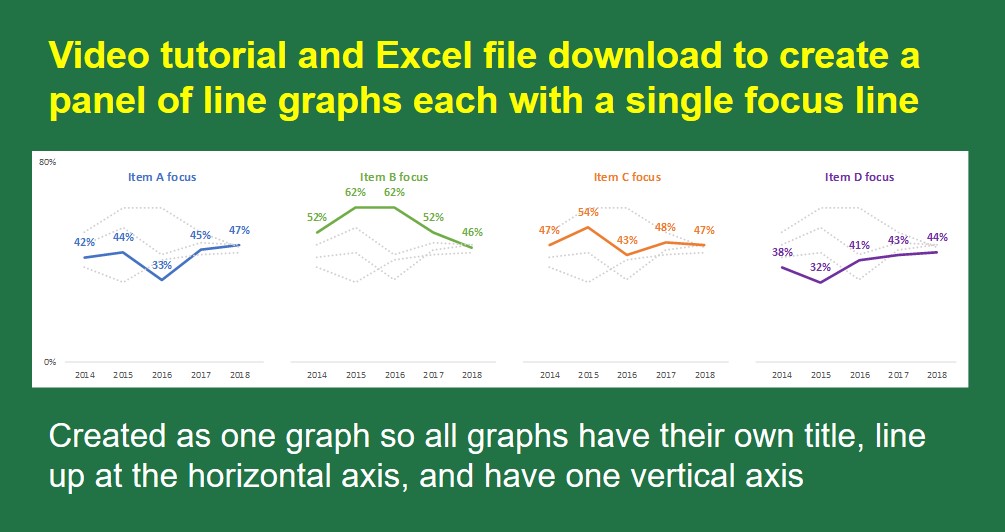
Video tutorial and Excel file download to create a panel of line graphs each with a single focus line
If you want to create multiple small line graphs, also called a panel of line graphs, this video will show you how to create them as a single graph, each with its own title, and all driven by the data table so it is not a lot of manual work when it is updated or you want to re-use it for other data.