Create a sliding timeline visual in PowerPoint to show many time periods or events
If you have many time periods to show in a timeline visual or you have many events to show on a timeline and cramming it in on a single slide would look too crowded, consider splitting the timeline across two slides. In the video below you will see how to create a sliding timeline that… Continue reading Create a sliding timeline visual in PowerPoint to show many time periods or events
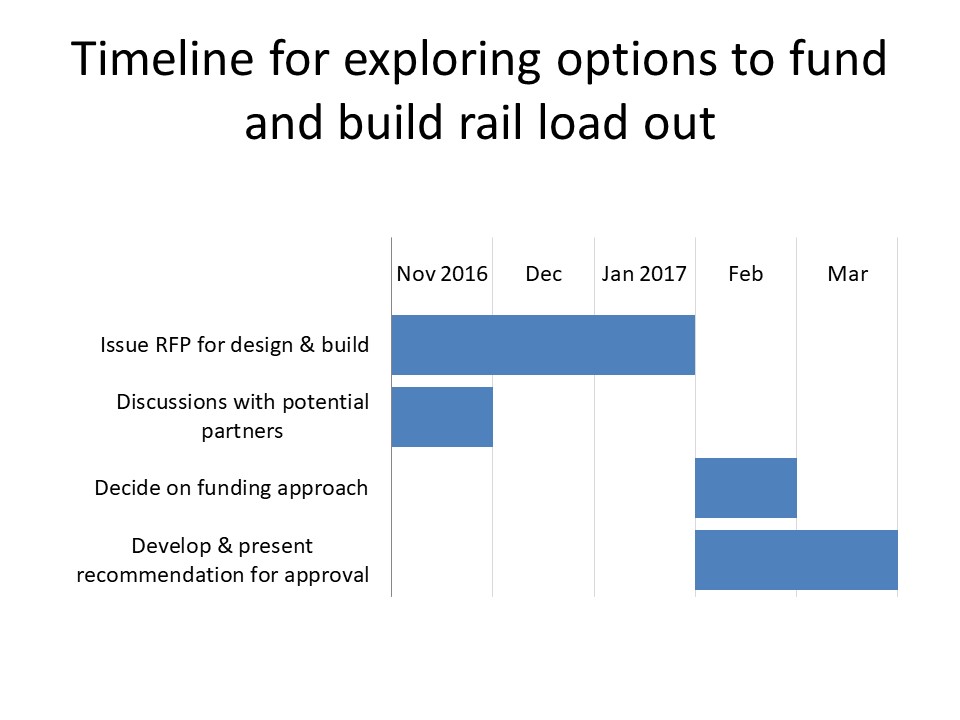
How to create a time scale in PowerPoint for timeline visuals, Gantt charts, and other time-based visuals
A timeline visual is a generic term used to describe any time-based visual. It consists of the time scale for the desired period of time and shapes or text that indicate the events during the time period shown. A Gantt chart is a specific type of timeline visual often used in project management. Here is… Continue reading How to create a time scale in PowerPoint for timeline visuals, Gantt charts, and other time-based visuals
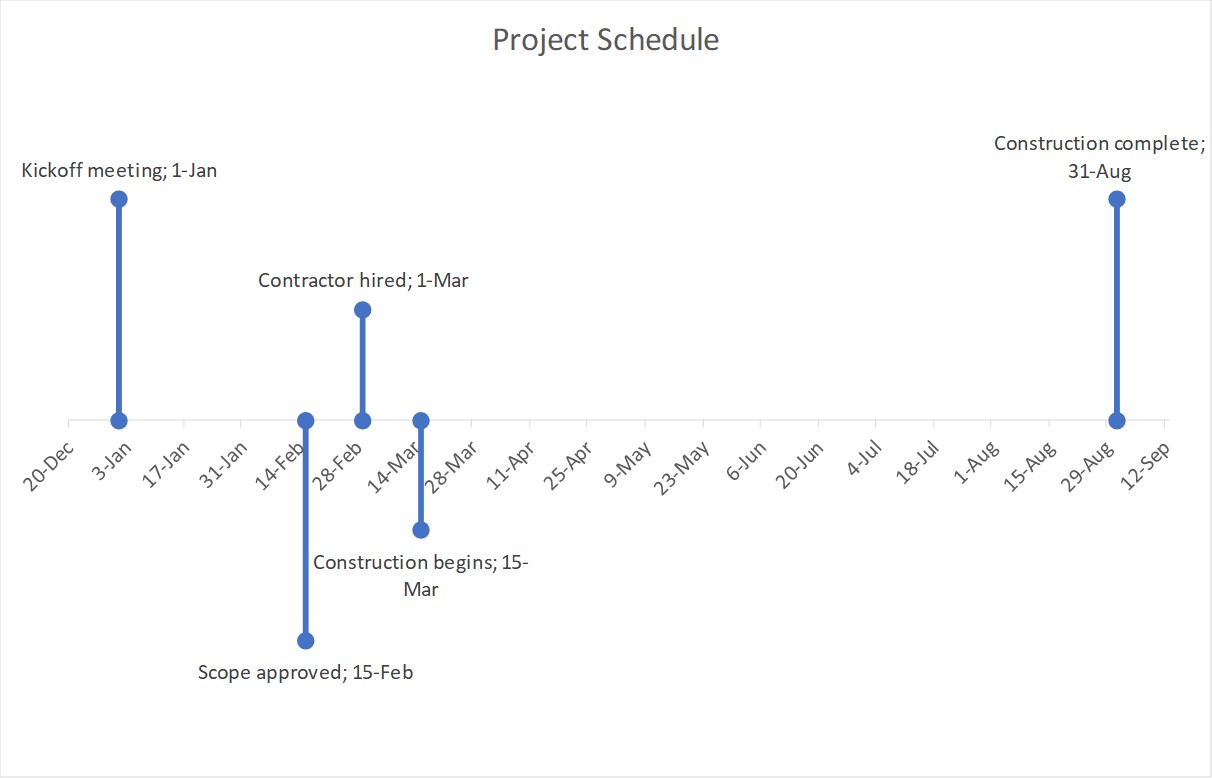
Accurate Design Ideas-like Timeline; Issue #424 October 2 2018
In a previous newsletter I showed an example of how PowerPoint’s Design Ideas feature (last week Microsoft changed the name from Designer to Design Ideas) can create a visual from a bullet list of dates for events. Here is the example it created. I like the idea of the events being placed on a timeline… Continue reading Accurate Design Ideas-like Timeline; Issue #424 October 2 2018
Showing the timing of steps in a project; Slide Makeover #90
Use a data-driven Gantt chart instead of a bulleted list of dates to show timing of steps.
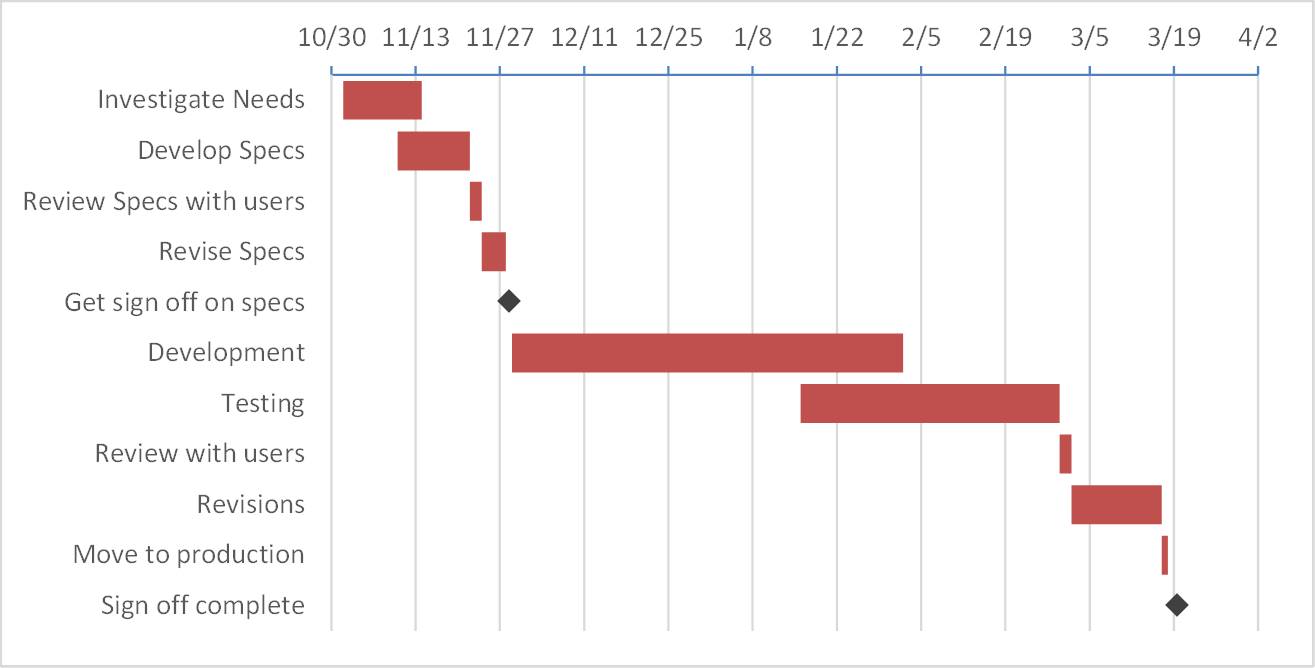
Creating a Gantt chart with Milestones using a Stacked Bar Chart in Excel or PowerPoint
When you need an accurate Gantt chart, you can use a stacked bar graph in Excel to create it
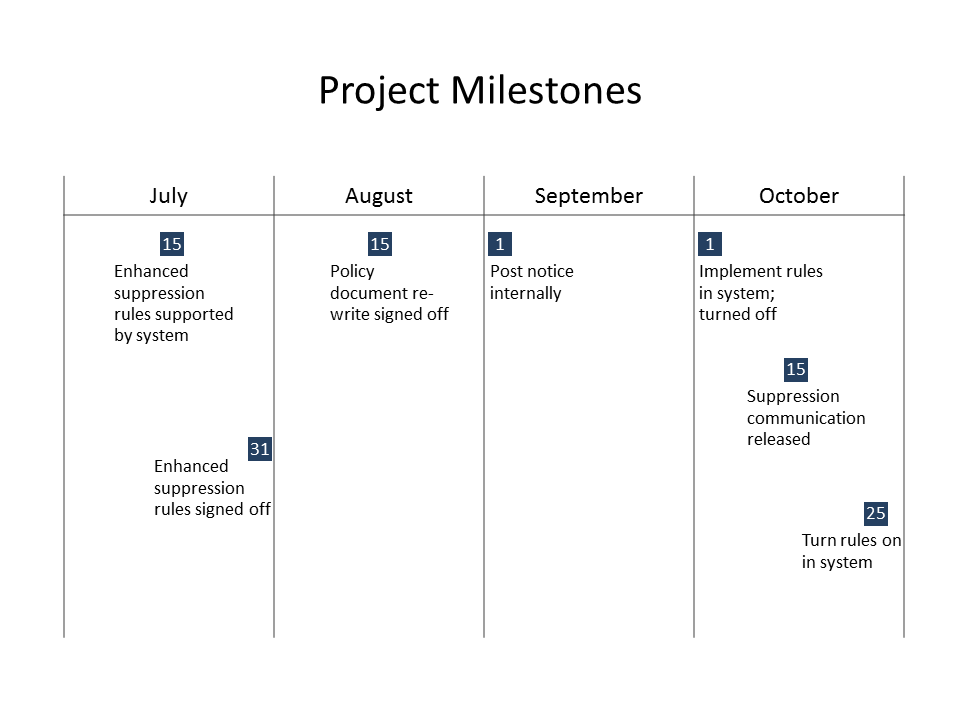
Download free Timelines & Calendars; Issue #371 August 30, 2016
Quickly create timeline visuals by starting with a pre-built timeline or calendar you can copy onto a PowerPoint slide