When you have two data series that represent different groups, a diverging stacked bar chart visual may be a better option than a stacked column or bar chart. Here is an example from a makeover in a recent customized workshop.
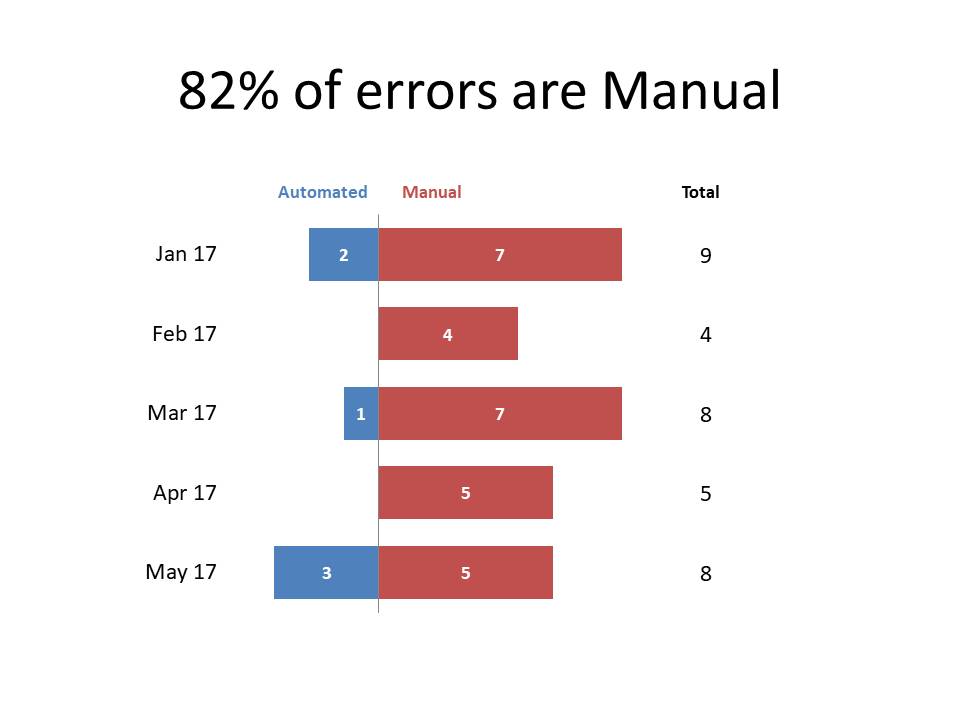
In this visual, the bars for the two series start from a center line and extend left and right. The audience can see the comparison of the values in each series because the bars for that series start at the same baseline. You can also add the total if needed as a separate column as shown in the example above.
Typically this visual would be created by using negative values in a stacked bar chart to create the bars on the left of the vertical axis. I have a calculator and video on how to do this here. This method requires the use of custom number formats for the negative numbers to display them as positive numbers.
Recently I discovered a new way to create this visual which uses some tricks to make it easier to display positive numbers for the left side bars. It uses the stacked bar chart, but uses spacers and moving the position of the axis. Let’s start by looking at the data table for the stacked bar graph.
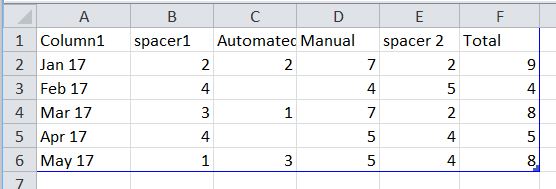
You can see that I have used a spacer segment to get the left side bars (the Automated data series in this example) to line up at the right side of each bar. The spacer1 plus Automated values total 4 for each category. By setting the spacer1 segment to be No Outline and No Fill, it disappears, leaving the Automated bars visible. Since the values for the Automated bars are positive, I can use the regular data labels and don’t need custom number formats.
To position the vertical line correctly, I change a setting in the Horizontal Axis options to position the vertical axis at the value of 4, the total of the spacer1 and left side bars used above.

In this example I also added the total of the two bars in a column on the right. I used an invisible spacer segment to line up the position of the Total segment for each category so it appears as a column. I set the Total segment to have No Fill and added a data label for the segment.
This visual can be used in any situation where you want the audience to compare the values in the two data series that represent different groups. It is particularly useful when the two groups represent favorable and unfavorable results in different categories. Try this method for creating a diverging stacked bar chart the next time you have to communicate this type of message.

Dave Paradi has over twenty-two years of experience delivering customized training workshops to help business professionals improve their presentations. He has written ten books and over 600 articles on the topic of effective presentations and his ideas have appeared in publications around the world. His focus is on helping corporate professionals visually communicate the messages in their data so they don’t overwhelm and confuse executives. Dave is one of fewer than ten people in North America recognized by Microsoft with the Most Valuable Professional Award for his contributions to the Excel, PowerPoint, and Teams communities. His articles and videos on virtual presenting have been viewed over 4.8 million times and liked over 17,000 times on YouTube.