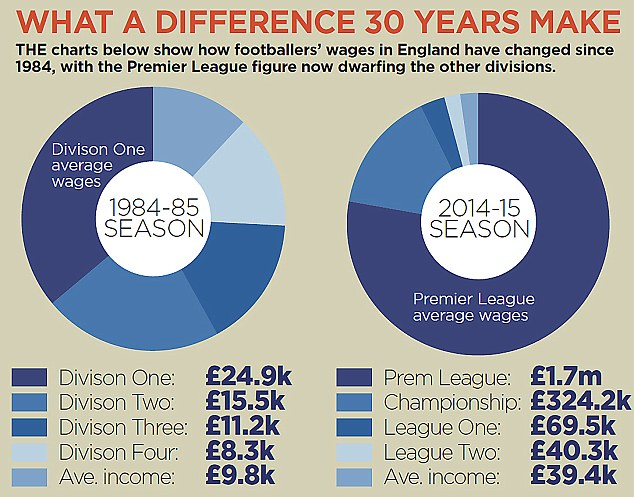
Today’s Makeover Monday from Andy Kriebel and Andy Cotgreave looks at the growth in UK soccer player salaries over the last 30 years. The original article is here and the key visual they asked people to make over is this:
Because the author included the average UK worker income, I thought that the key insight would be to see how the salary growth in each level compared to the growth in the average worker salary. Are the salaries in each level growing at about the same rate as the average worker, or are we seeing much higher growth at the top levels, as we see in the overall population.
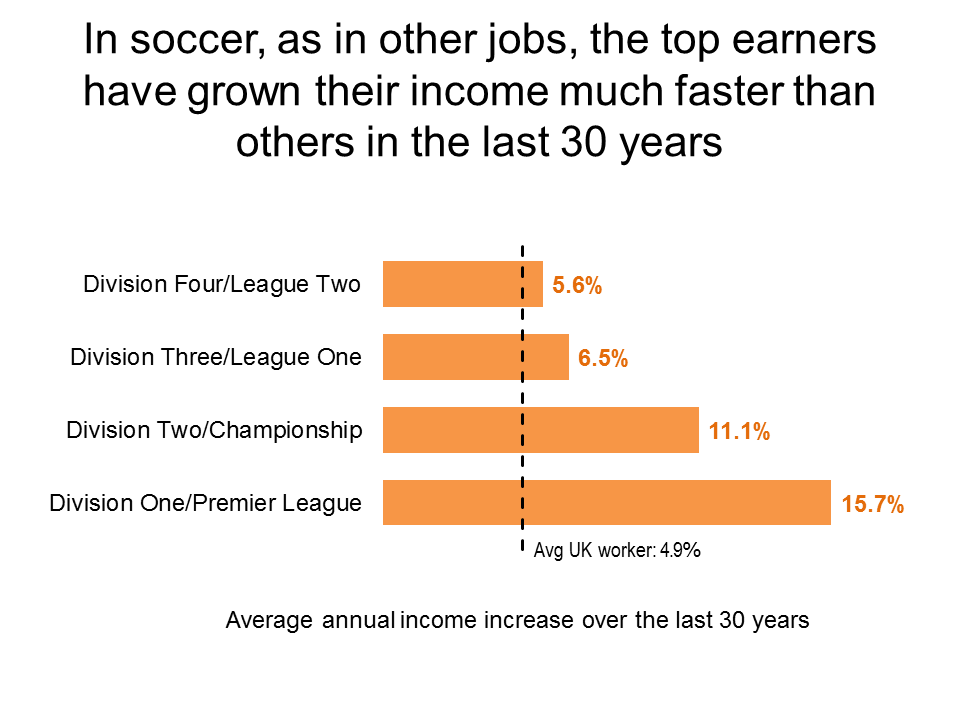
I calculated the compound annual growth rate (CAGR) for each of the groups. I wanted to compare each level in soccer against the average worker, so I used a bar chart with a dashed line for the average worker. Here is the visual I created:
The bottom two levels of UK professional soccer have salary growth just higher than that of the average worker. The top two levels show growth more than double and triple that of the average worker. The conclusion? In soccer, as in the general population, we are seeing much higher income growth at the top levels.
Tools used: Excel 2010 to do the calculations; PowerPoint 2010 to create the graph (the technique to create the dashed line as a second chart type with a bar graph is explained in my Implementation Guide for Creating Graphs and Visuals for Data)

Dave Paradi has over twenty-two years of experience delivering customized training workshops to help business professionals improve their presentations. He has written ten books and over 600 articles on the topic of effective presentations and his ideas have appeared in publications around the world. His focus is on helping corporate professionals visually communicate the messages in their data so they don’t overwhelm and confuse executives. Dave is one of fewer than ten people in North America recognized by Microsoft with the Most Valuable Professional Award for his contributions to the Excel, PowerPoint, and Teams communities. His articles and videos on virtual presenting have been viewed over 4.8 million times and liked over 17,000 times on YouTube.


