905-510-4911 Dave@ThinkOutsideTheSlide.com
  • Twitter
  • Twitter
0 Items
Think Outside The Slide
  • Managers and Leaders
    • Training for Virtual Presentations
    • Customized Training Workshops
    • FinancialViz Workshops
    • Chart Worksheet Template Consulting
    • Presentation Consulting
  • Help for Presenters
    • Books
    • Online Courses & Videos
    • Implementation Guides
    • Public Events
  • Free Resources
    • Articles
    • Newsletter
    • Presenting Financial Information Visually in PowerPoint
    • FinancialViz Inspiration / Examples
    • Slide Makeovers
    • Latest Annoying PowerPoint Survey Results
    • The State of Financial Presentations Survey Results
    • PowerPoint Tutorials
    • Color Contrast Calculator
    • Selecting the correct font size
    • Download Free Timelines and Calendars
    • Calculators for Visuals
      • Waterfall Graph Calculator
      • Proportional Object Collection Calculator
      • Diverging Stacked Bar Chart Calculator
      • Simple Treemap Calculator
      • Stacked Bar Chart Breakdown Calculator
      • Small Multiples Calculator
      • Funnel Chart Calculator
    • PowerPoint Effectiveness Assessment
    • Solving Presentation/ PowerPoint Problems
  • Create Excel Charts
    • Basic Excel Chart Skills
    • Intermediate Excel Chart Skills
    • Advanced Excel Chart Skills
    • Customized Excel Chart Training Workshops
    • Excel Chart Videos & Online Courses
  • About Dave Paradi
    • Bio & Background
    • Blog
    • Photos & Introduction
    • Dave’s Schedule
    • Media Appearances
    • Client List
    • Recommended Products and Services
    • Payment Policy
    • Contact
Select Page

FinancialViz Category: Portion of a Total

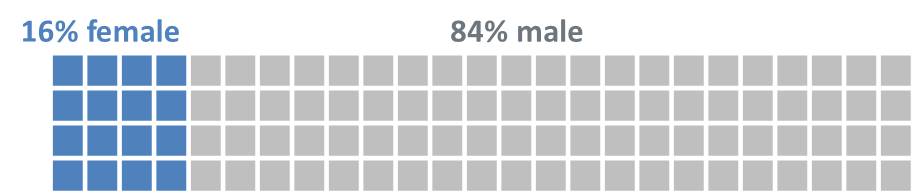
Proportion visual using characters; Issue #395 August 8, 2017

Use ISOTYPE or group of items visuals to show proportion of the whole

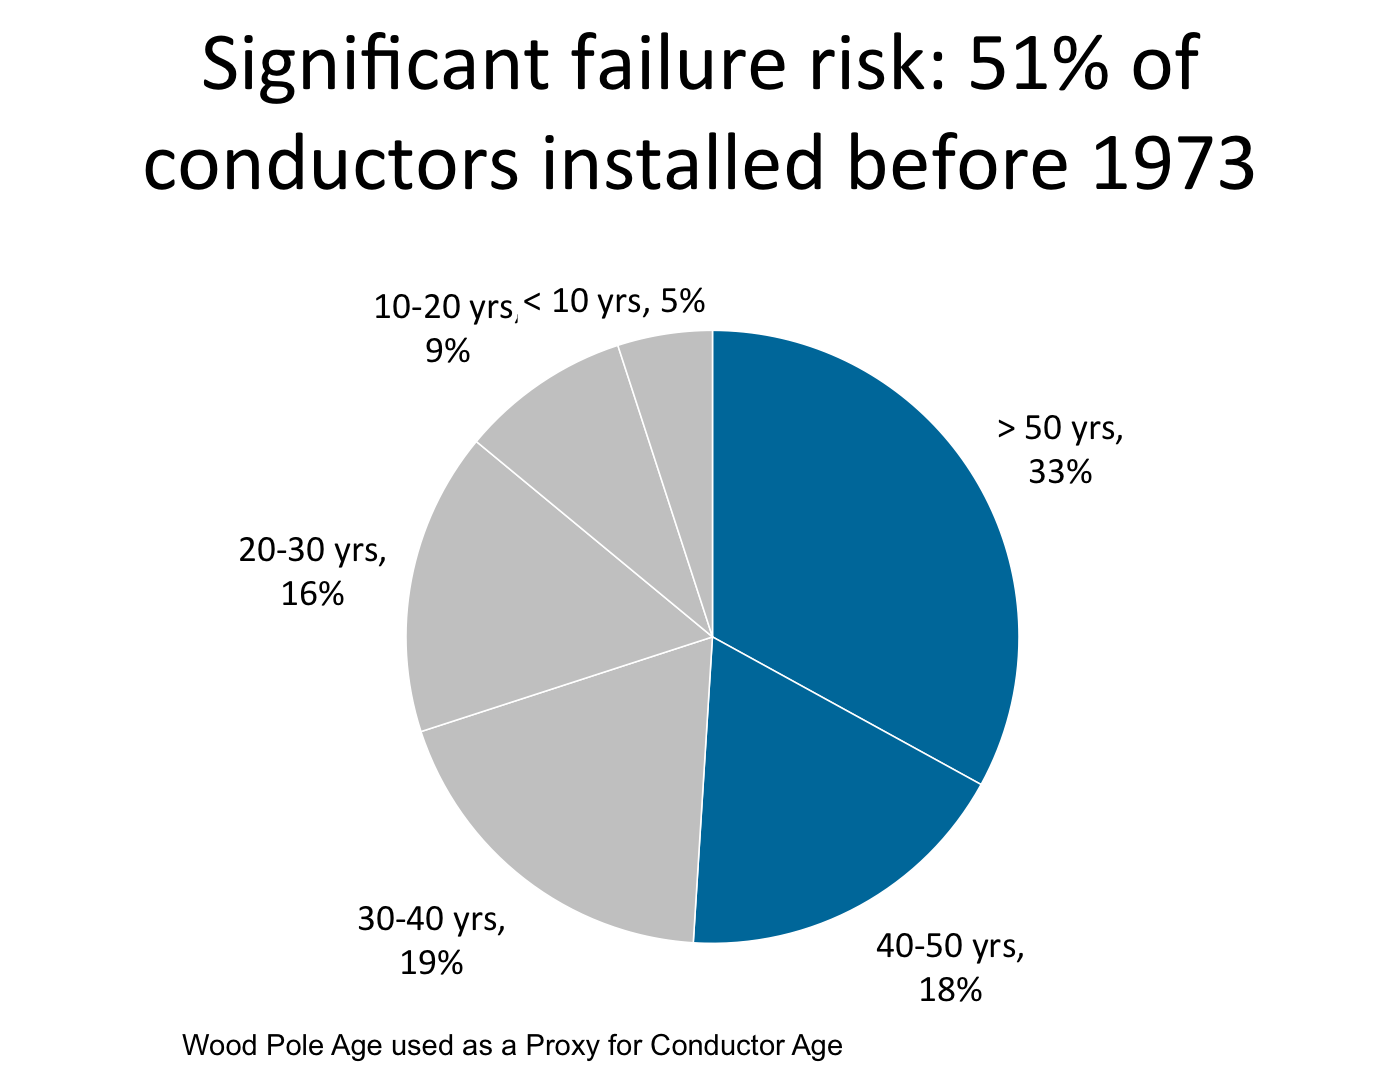
The correct use of a pie chart; Issue #327 December 23, 2014

The correct use of a pie chart is to show one segment compared to the whole; Use bar charts for ranked values

©2005-2021 Dave Paradi - PrivacyPolicy: We will never sell or distribute your e-mail or information to anyone. Contact: Dave@ThinkOutsideTheSlide.com or Call (905) 510-4911 Microsoft, PowerPoint, Windows and other terms are either registered trademarks or trademarks of Microsoft Corporation in the United States and/or other countries. Microsoft product screen shot(s) reprinted with permission from Microsoft Corporation. All books, products and seminars are independent publications and are not affiliated with, nor have they been authorized, sponsored, or otherwise approved by Microsoft Corporation. Disclaimer: Some of the links in my newsletter or on my website may be affiliate links where I am paid a small commission for recommending a product or service that I personally use and trust. I will not recommend any product or service that I do not stand behind, and any compensation that I may receive is minimal and will not influence my recommendations. Required by Amazon: As an Amazon Associate I earn from qualifying purchases.