FinancialViz makeover: Make a Top 5 / Bottom 5 bar chart communicate clearly
This makeover is a recent visual I worked on and is similar to the “Top 5 / Bottom 5” visuals I see in my FinancialViz training courses. In this video I show you how to make the message clearer and it is done only using Excel, what you are already using. If you want to… Continue reading FinancialViz makeover: Make a Top 5 / Bottom 5 bar chart communicate clearly
AFP Article June 6 2022
The Association for Financial Professionals (AFP) published an article showing some of the makeovers of data heavy slides that were recently featured in a webinar I was a part of. You can see the before and after slides in the article here. The makeovers I submitted are #1, 2, 3, and 5.
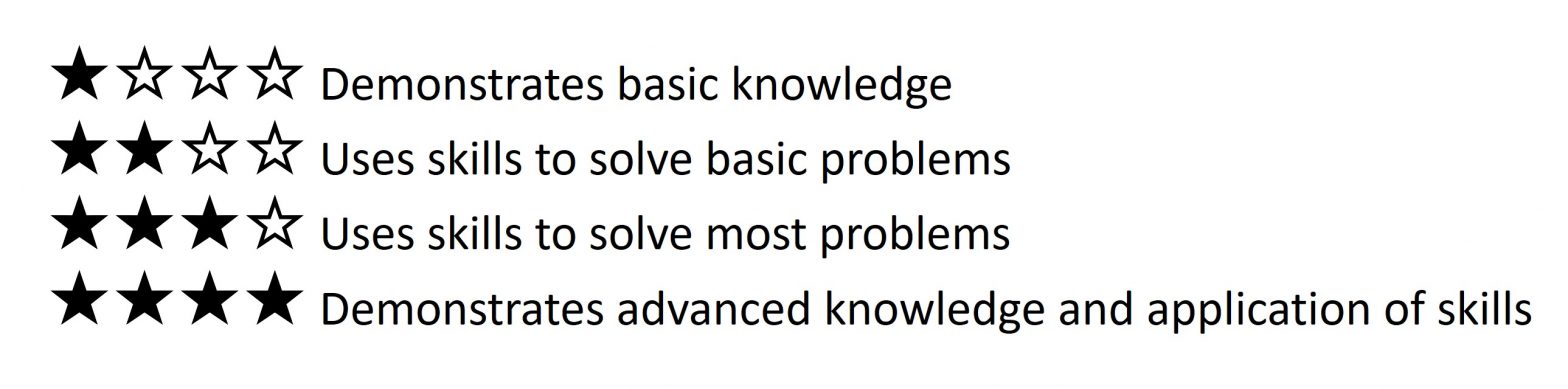
Showing skill level ratings; Slide Makeover #96
Using visuals can sometimes be frustrating because of the time it takes to create them and the challenge of getting them to look good. This makeover demonstrates how you can use symbols and text in a single text box to quickly create a visual instead of the time it takes to create shapes and multiple… Continue reading Showing skill level ratings; Slide Makeover #96
Excel bar chart with conditional formatting based on MoM change %
Conditional formatting of Excel charts allows you to have the formatting of the chart update automatically based on the data values. A common approach is to use the values as the criteria as shown in the article and video on creating a conditional formatting column chart. In this article and video I want to show… Continue reading Excel bar chart with conditional formatting based on MoM change %
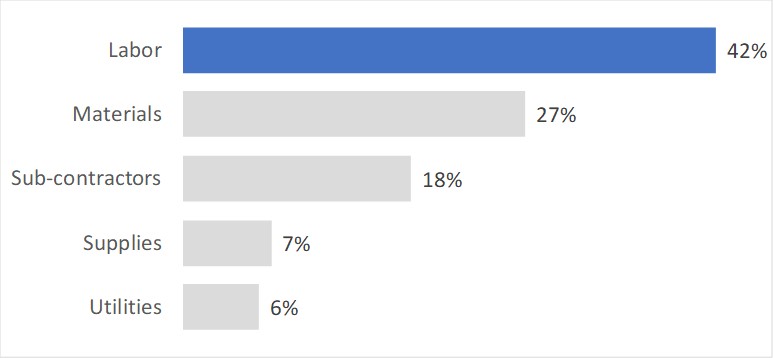
Presenting the income or P&L statement: How to highlight the largest revenue segment or expense item
You’ve analyzed the income and expenses and need to communicate important findings to the executives or Board. If you want to focus on the largest revenue segment (product, geographic region, etc. ) or expense item, watch this video to learn how to use a bar chart with color focus to show the data and direct… Continue reading Presenting the income or P&L statement: How to highlight the largest revenue segment or expense item
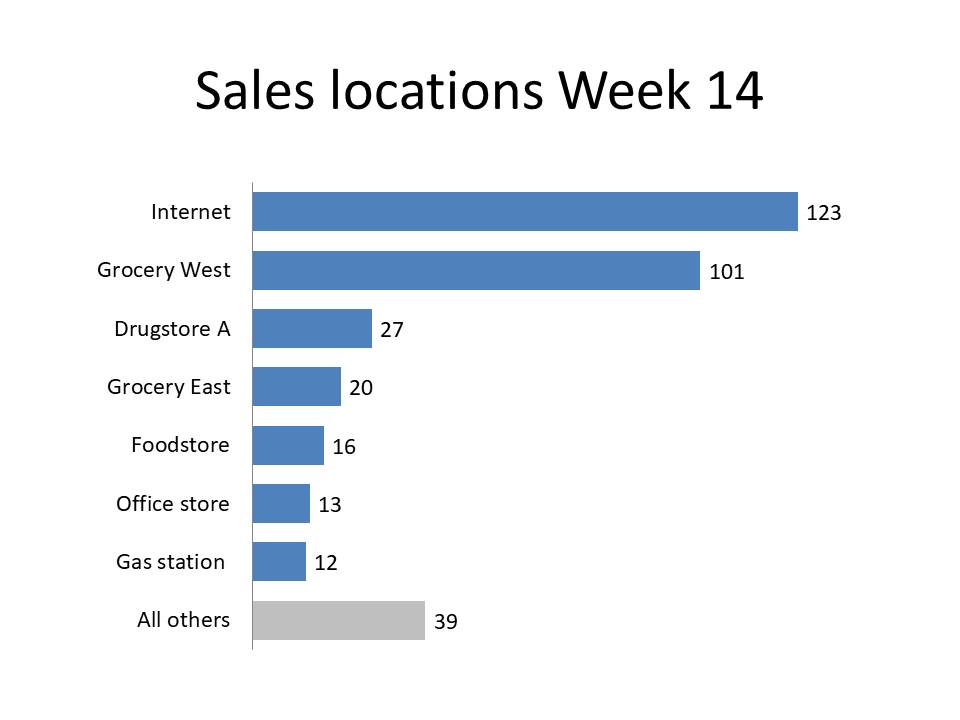
Focus by using an All Others category; Issue #396 August 22, 2017
Use an All Others category when showing ranked data to focus on the most important categories
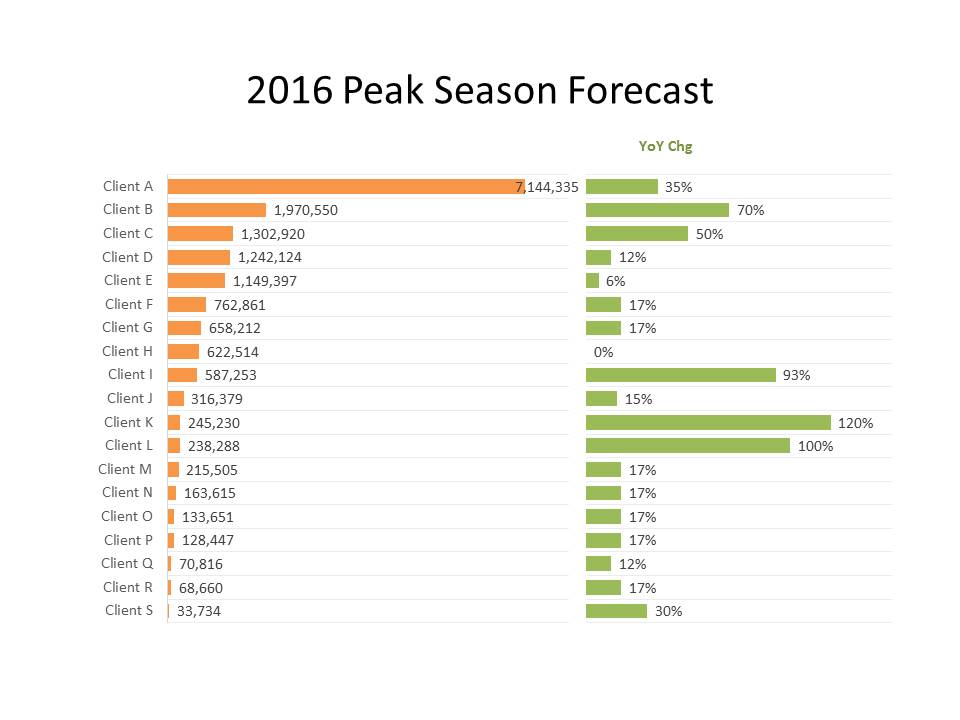
When gridlines help on graphs; Issue #387 April 18, 2017
When showing ranked values with a related data series, use gridlines to help the audience relate the values
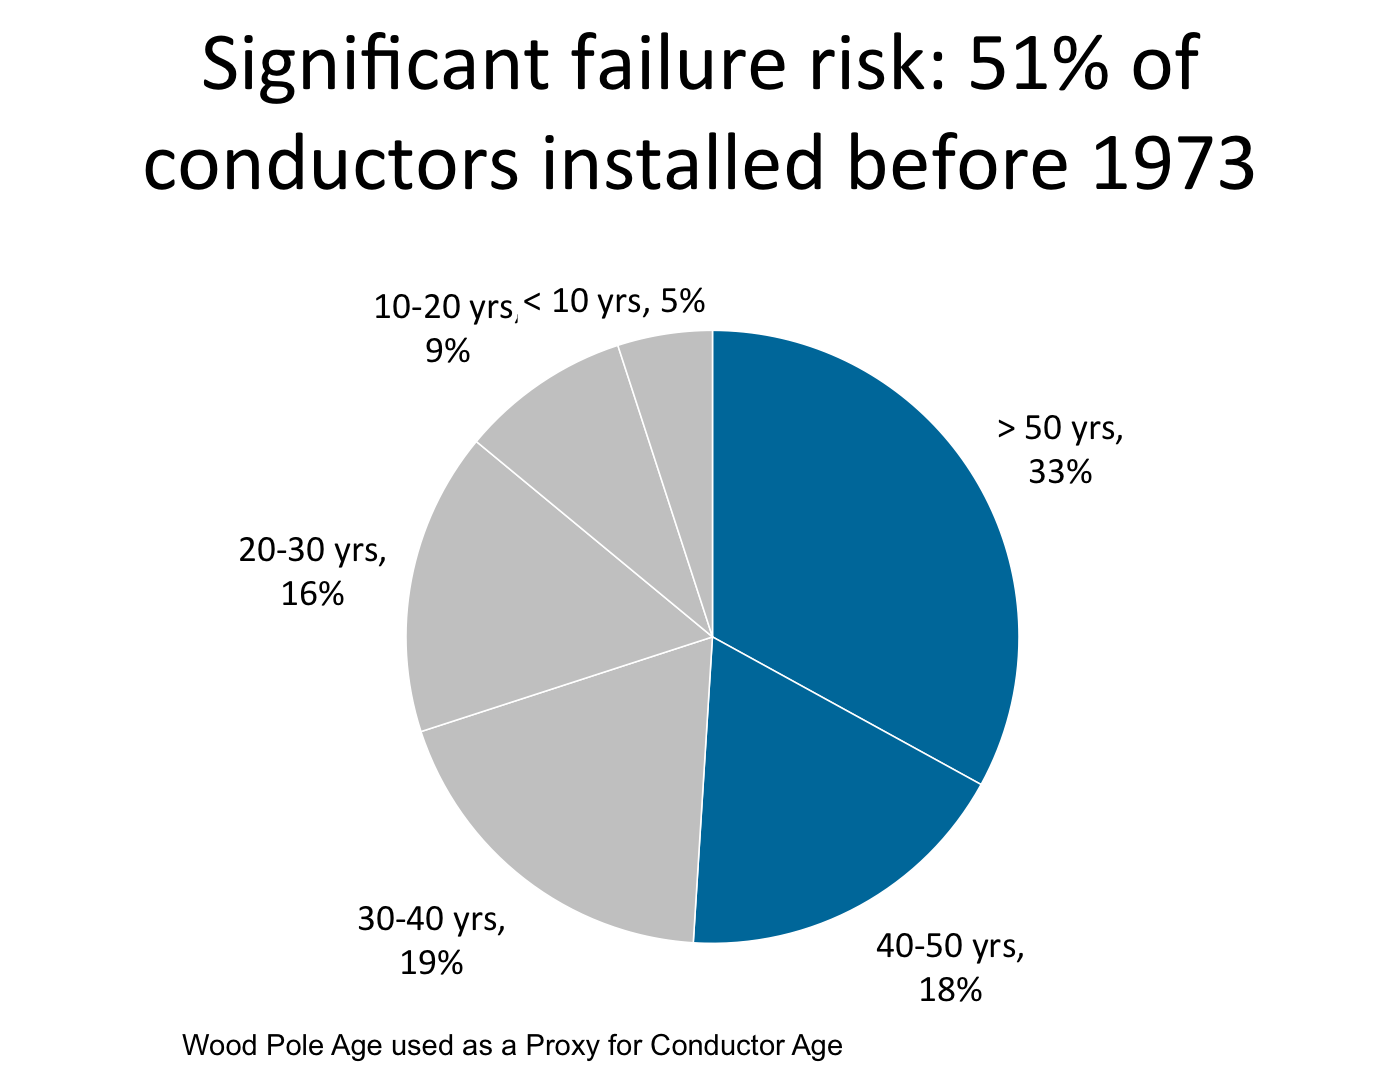
The correct use of a pie chart; Issue #327 December 23, 2014
The correct use of a pie chart is to show one segment compared to the whole; Use bar charts for ranked values