A balance sheet is one of the three most common financial statements required to be presented to executives, Boards, and investors. It is different from an income/profit & loss statement and a cash flow statement because it reports values at a single point in time, not over a time period. In most cases, financial professionals simply copy the statement in table or spreadsheet format onto a slide. The executives or board members get overwhelmed with the numbers and ask many questions to try to figure out what the key messages are.
Is there a better way to present this statement? No. In fact, I suggest you don’t present the balance sheet at all. How can I say that when it is one of the required statements? Because I don’t think the statement should be presented, it should be sent in advance to satisfy the regulatory and audit requirements. Instead, I suggest you focus your presentation on what the executives and Board really need to hear, which is what is behind the change in the numbers on the balance sheet from a previous point in time.
Because the balance sheet reports only at a single point in time, you need to put the numbers in context for the audience. You need to compare them to a previous point in time, usually the previous quarter or same time the previous year. The executives and Board want to know why the values have changed and if there are actions they need to take in order to move the future values closer to the organization’s goals.
In the Assets section of the balance sheet, changes in current assets are likely due to operations, and the explanations may need to highlight major operational changes or impacts. Changes in long-term assets are usually related to physical assets and often occur because previous decisions to purchase or dispose of equipment, land, buildings, etc. have been implemented during the time between the two balance sheets. Highlights in this section may have to do with differences between what was anticipated vs. what actually happened, and often relate to capital expenditures that had been discussed and approved in the past.
In the Liabilities portion of the balance sheet, the current liabilities again relate mostly to operations with explanations needed for any significant changes or timing issues. The long-term liabilities relate mostly to the implementation of past financing decisions, such as issuing debt or retirement of debt previously issued. The executives or board members will want to know whether the actual impact on the balance sheet from the decisions they made in the past where more or less than anticipated when they made the decisions. They also need to know if there are future impacts of debt maturity or other items that will impact this section of the balance sheet.
The final section of the balance sheet, the Shareholder’s Equity section, relates mostly to the number of shares outstanding. Changes can be impacted by issuance of new shares or the buyback of shares in the market. Differences in proceeds from issuing new shares or changes in the cost of buying back shares are of most interest to the executives and board members.
You can make the important messages behind the numbers on the balance sheet clear by using visuals instead of spreadsheets or tables on slides. Here are some visuals that can be used to communicate some of the common messages that result from analysis of the differences between two balance sheets.
Visually show Assets (or Liabilities) with YoY change
Waterfall graph to explain difference in cash position between start and end of year

Steps to a total graph to show when share buybacks happened during the last year

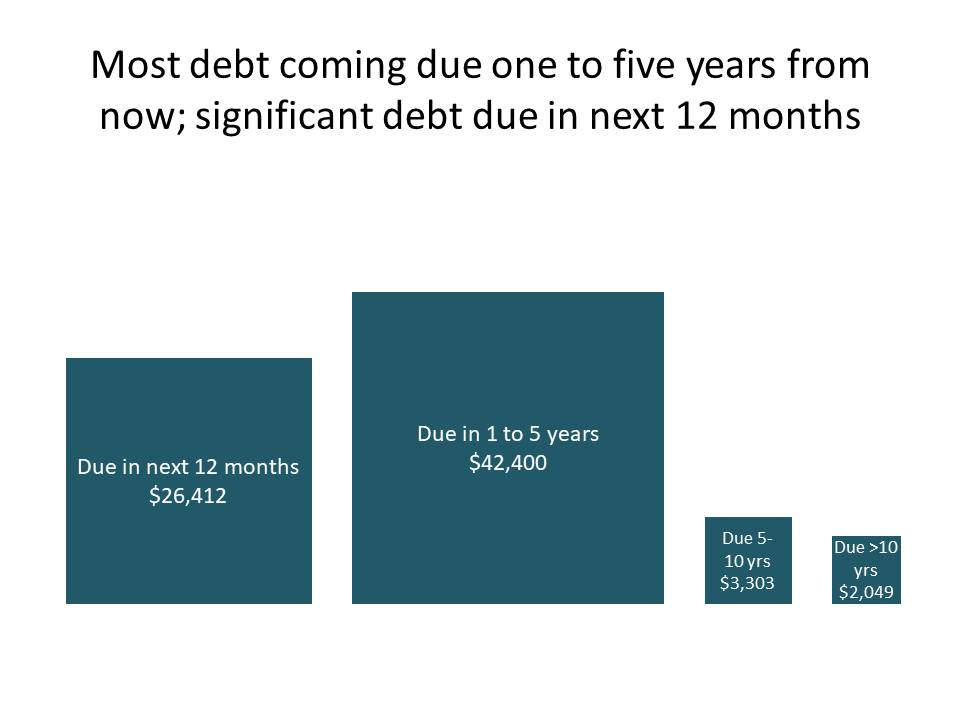
Proportional objects to show amount of debt maturing in the future
Bar chart showing which lines in the assets section contributed to the change in assets

(Note: All the visuals above were created in plain PowerPoint or Excel without any plug-ins, add-ins, or VBA programming, so you can create effective visuals with the tools you already use.)
When you are required to review the balance sheet with executives or the Board, send it out in advance. Let them know that you want to explain the significant changes from the previous balance sheet. Use visuals to explain the key messages and your presentation will be much more effective.
[If you are responsible for presenting financial statements, check out the other articles in this series on presenting an Income/P&L statement and presenting a cash flow statement.]
Dave Paradi has over twenty-two years of experience delivering customized training workshops to help business professionals improve their presentations. He has written ten books and over 600 articles on the topic of effective presentations and his ideas have appeared in publications around the world. His focus is on helping corporate professionals visually communicate the messages in their data so they don’t overwhelm and confuse executives. Dave is one of fewer than ten people in North America recognized by Microsoft with the Most Valuable Professional Award for his contributions to the Excel, PowerPoint, and Teams communities. His articles and videos on virtual presenting have been viewed over 4.8 million times and liked over 17,000 times on YouTube.