Today’s news provided an ideal example of when a small multiples visual works well. One of the top business news stories is the proposed takeover of delivery service TNT by FedEx. One of the key reasons for the merger is that it will boost FedEx’s market share in Europe, where they are currently the fourth place player.
To show the differences in market share of the leading companies in different regions of the world, two leading business newspapers created very different visuals. In Canada, The Globe and Mail created the following stacked column graph.
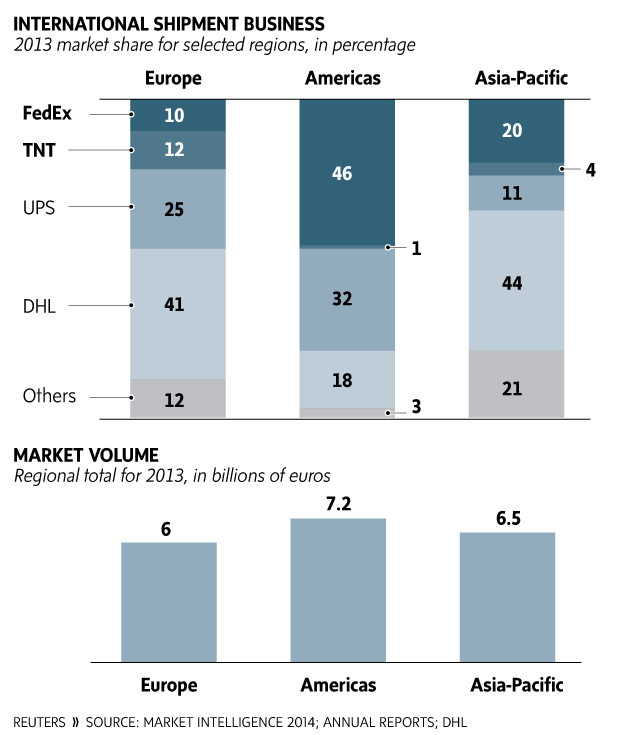
The problem with this visual is that if you are trying to see who is the dominant company in each of the regions, it becomes very difficult. A stacked column graph is hard to understand when you want to compare the breakdown in one column to the breakdown in another.
The Wall Street Journal tackled the same data using three donut graphs.
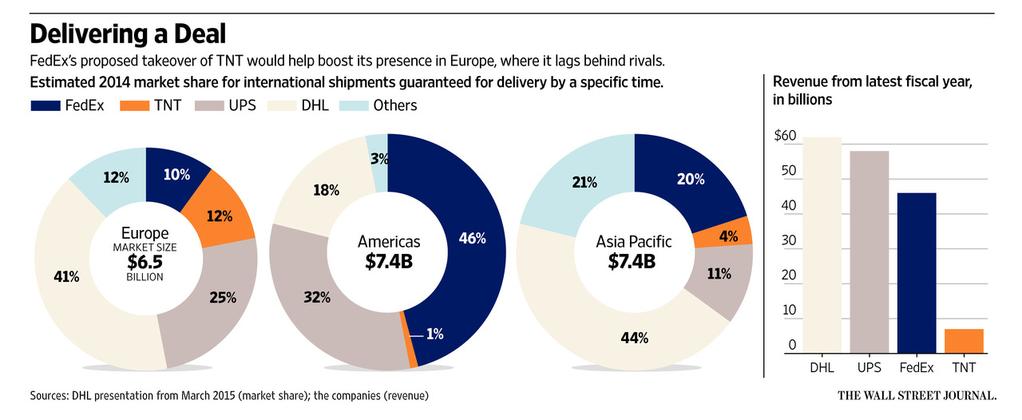
While the size of the donut is related to the size of the market, the real message is the breakdown of the segments in the donut. Again, this is very difficult to do. I would suggest it is even harder with this visual because you have to jump back and forth between the donuts.
A small multiples bar chart works much better. Here is the visual I created.
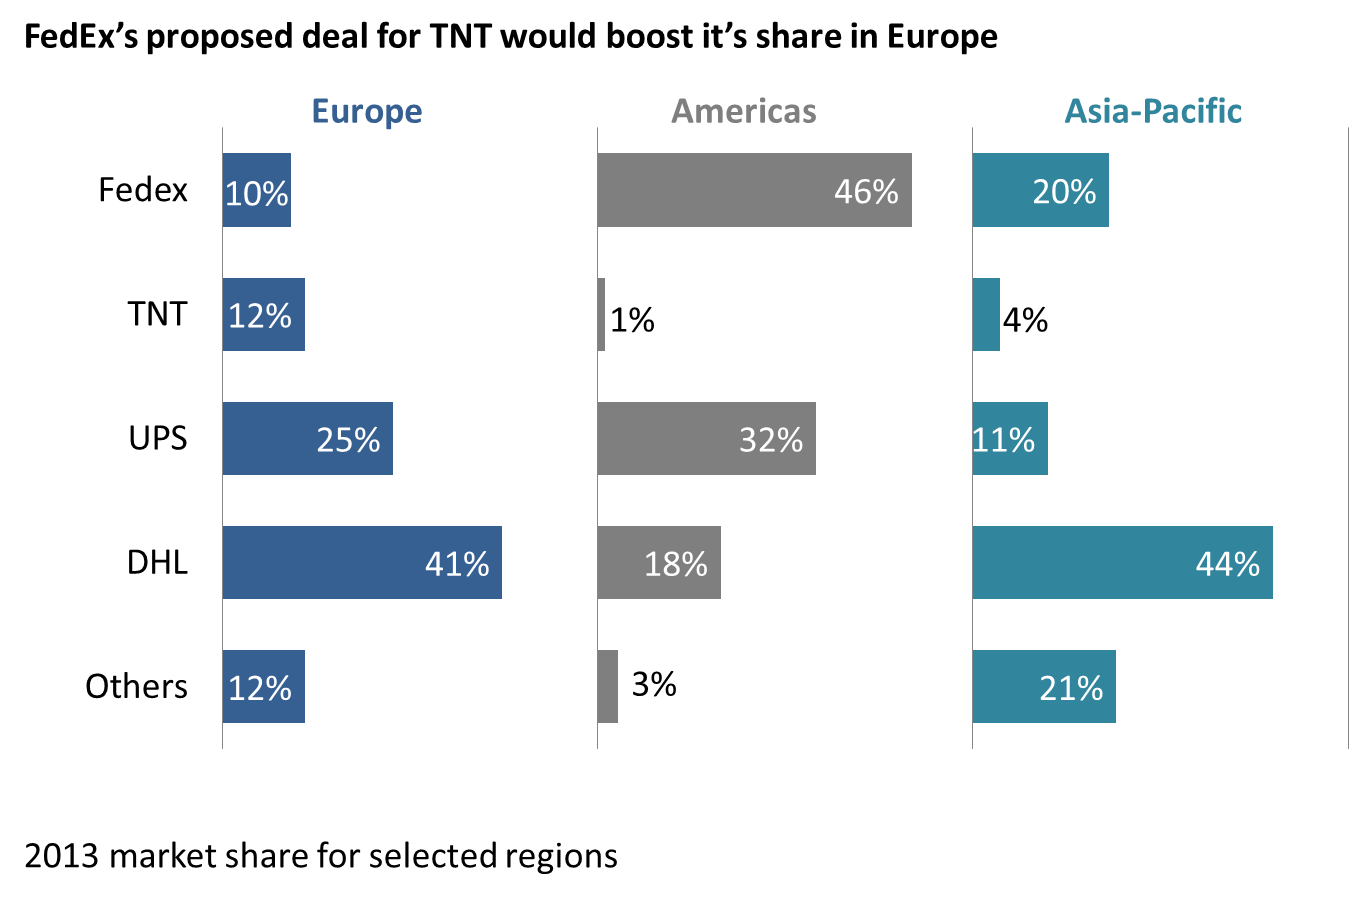
With a bar chart for each region, you can quickly see who dominates in each region. You can also see which players are strong in one region but weak in other regions.
This visual can be created in Excel or PowerPoint and is useful when you have a comparison of multiple data series across multiple categories. It isn’t the best choice every time, but I think it is a better choice for this message today. If you want help creating this type of visual, check out the Small Multiples Calculator which does the calculations so you can create this visual using an Excel or PowerPoint stacked bar chart.

Dave Paradi has over twenty-two years of experience delivering customized training workshops to help business professionals improve their presentations. He has written ten books and over 600 articles on the topic of effective presentations and his ideas have appeared in publications around the world. His focus is on helping corporate professionals visually communicate the messages in their data so they don’t overwhelm and confuse executives. Dave is one of fewer than ten people in North America recognized by Microsoft with the Most Valuable Professional Award for his contributions to the Excel, PowerPoint, and Teams communities. His articles and videos on virtual presenting have been viewed over 4.8 million times and liked over 17,000 times on YouTube.