TimeSlides.com
Pre-made PowerPoint slides to visually show relationships over time
One of the categories of messages that I discuss in my book Select Effective Visuals is a relationship over time. Whenever you are creating a visual that represents time periods, it is important that the time periods be accurately represented. To make it easier for presenters to create visuals that represent relationships over time, I have created three files of pre-made PowerPoint slides that save you the time of creating timelines and calendars on your own. Download the one you need for the presentation you are working on, or download all three to keep as a starting point for future presentations. Each file contains instructions on how to use the visuals on the slides in that file.
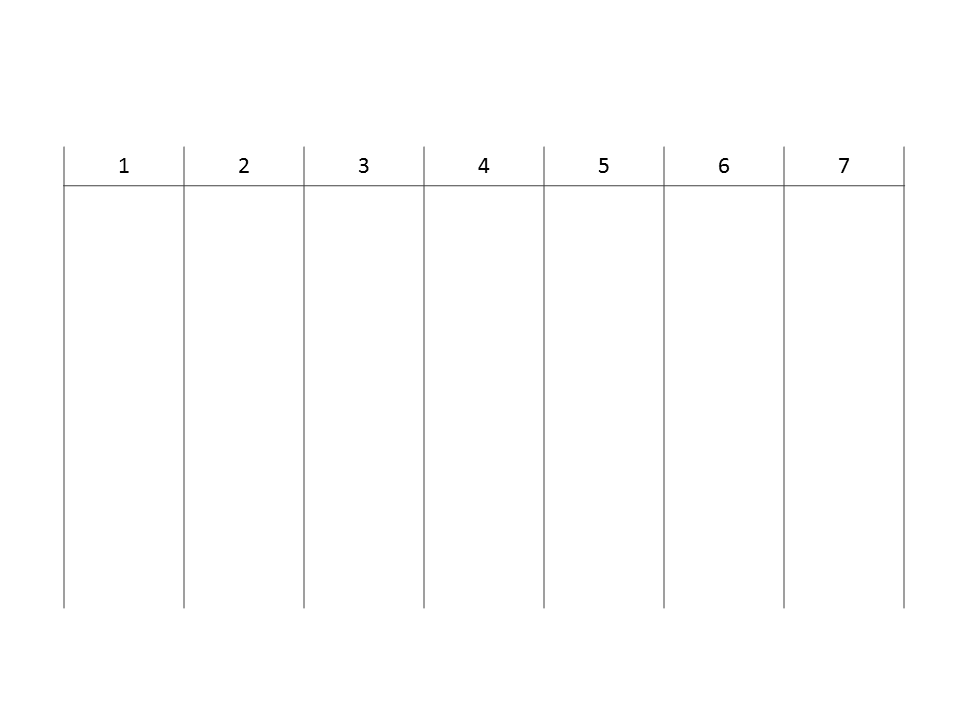
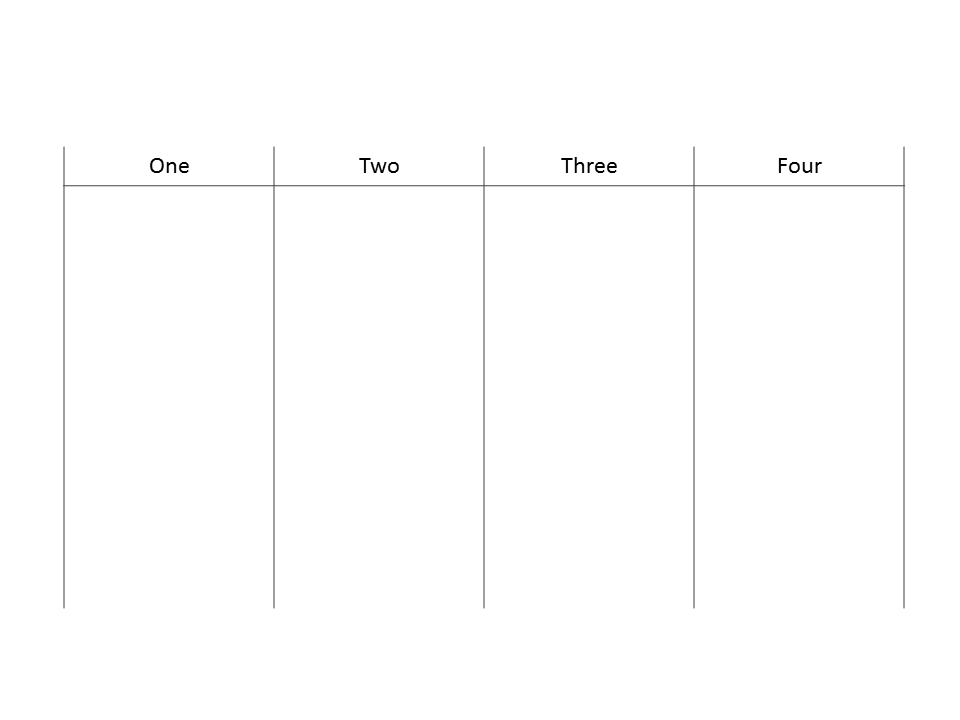
File #1: Timelines
Contains timelines for 2-24 time periods. Created using a table so all time periods are the same width.
Right-click here to download the file of Timelines
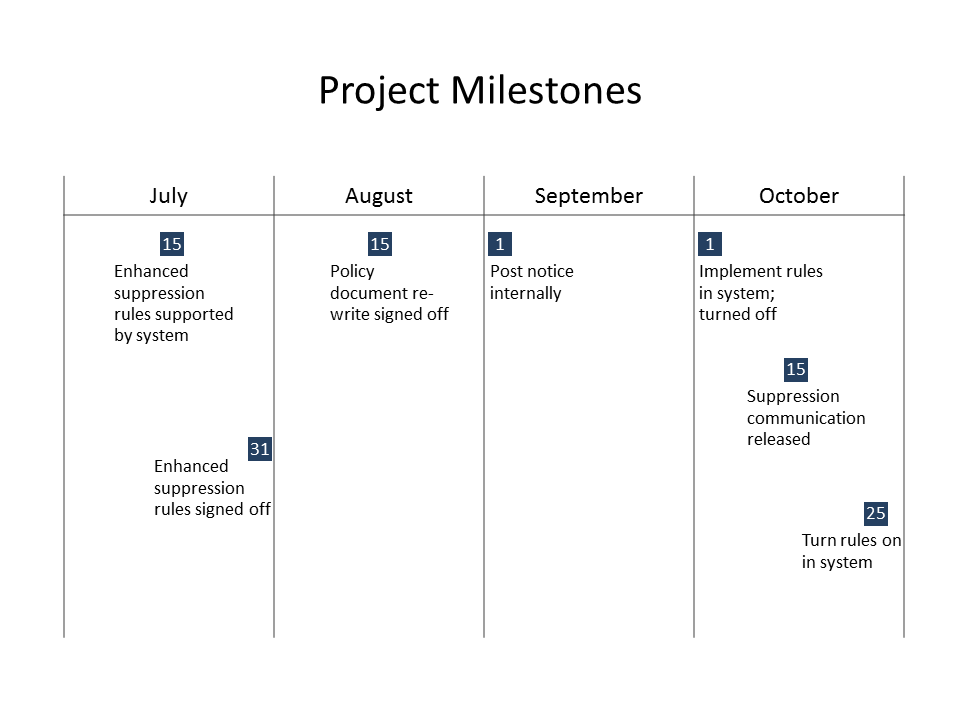
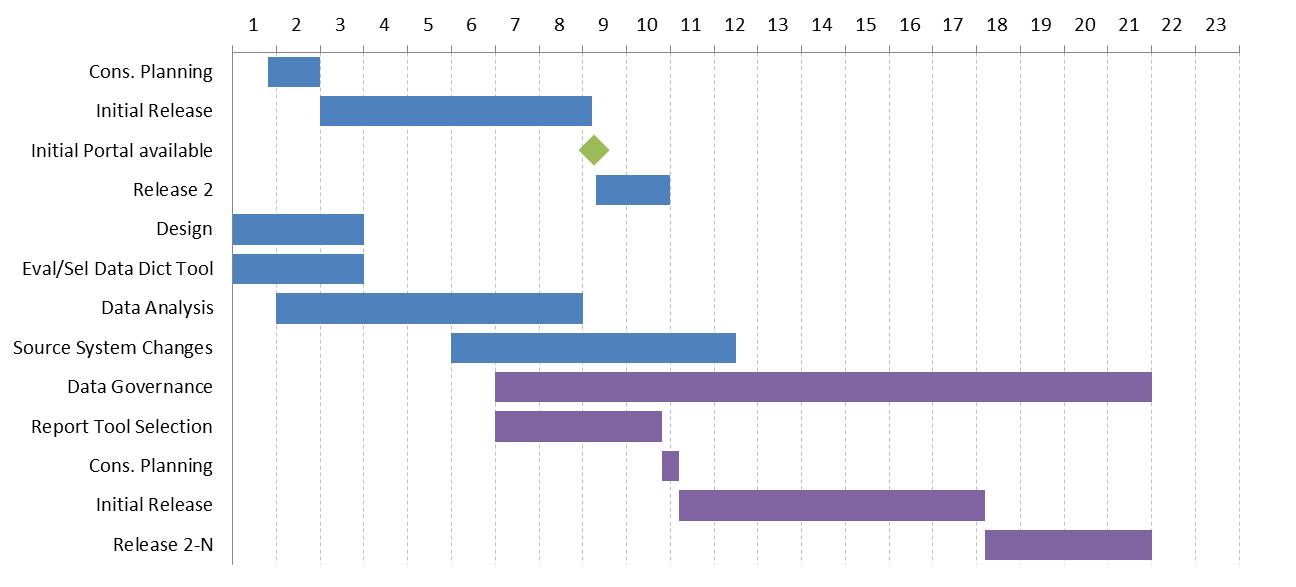
Example #1: Gantt chart
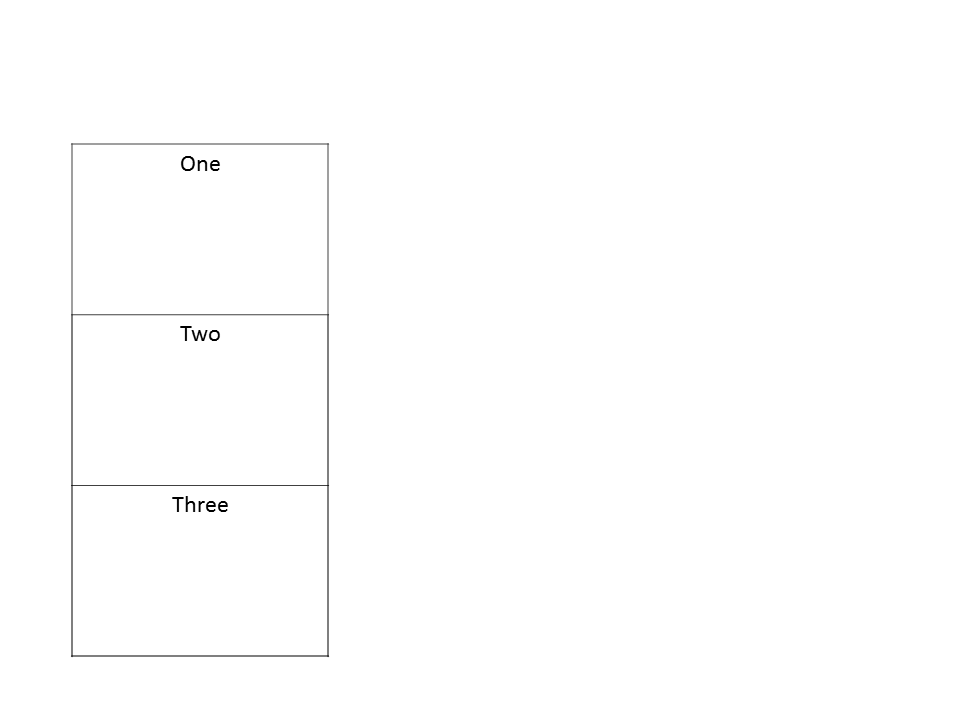
Start with
Quickly create
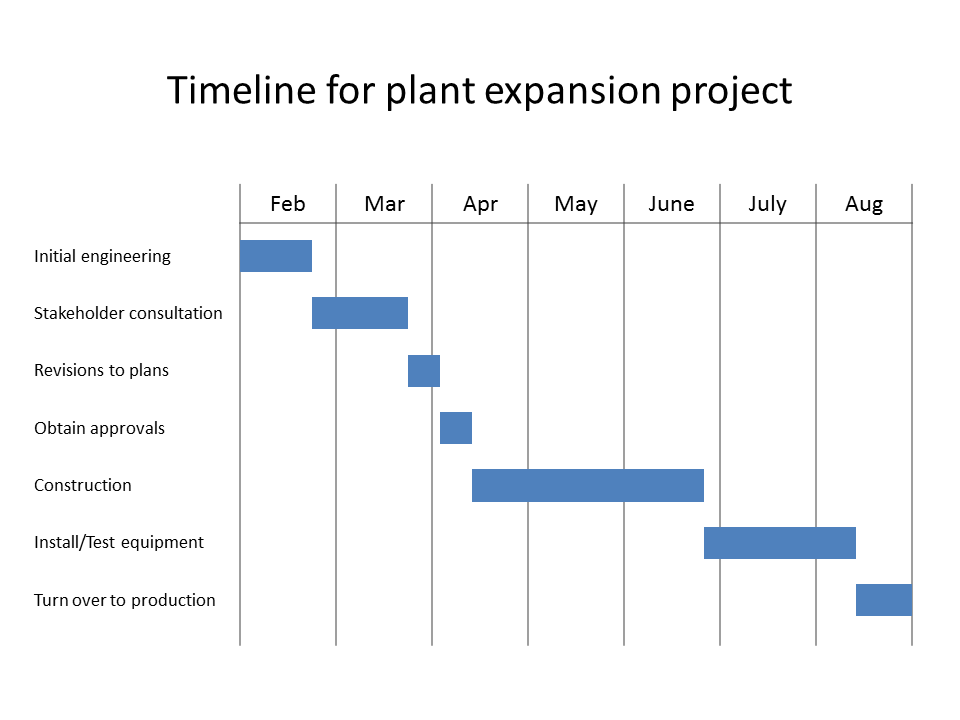
Steps to create a Gantt chart from one of the timeline visuals: Resize the table to fit the space on the slide; replace default time segment headings with month abbreviations; add text and rectangles
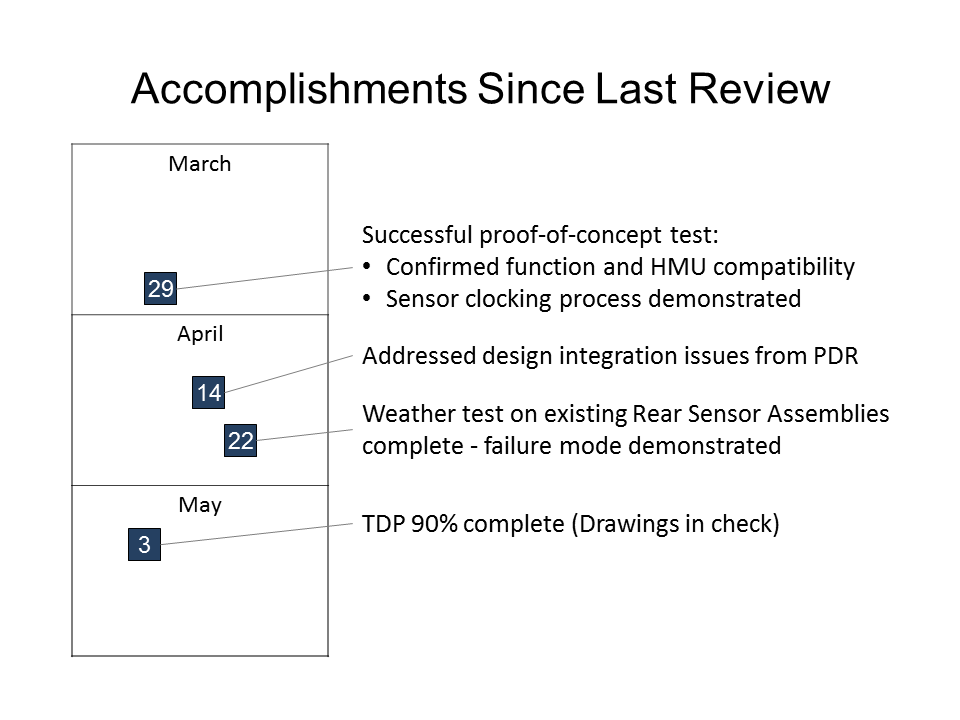
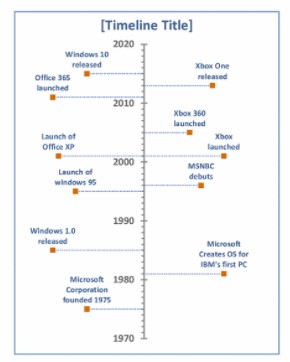
Example #2: Timeline of events
Start with
Quickly create
Steps to create a timeline of events from one of the timeline visuals: Replace default time segment headings with month abbreviations; add text and rectangles
File #2: Monthly calendars
Contains calendars with a rectangle for each month for 2-12 months. Created using a table so all time periods are the same width.
Right-click here to download the file of Monthly Calendars
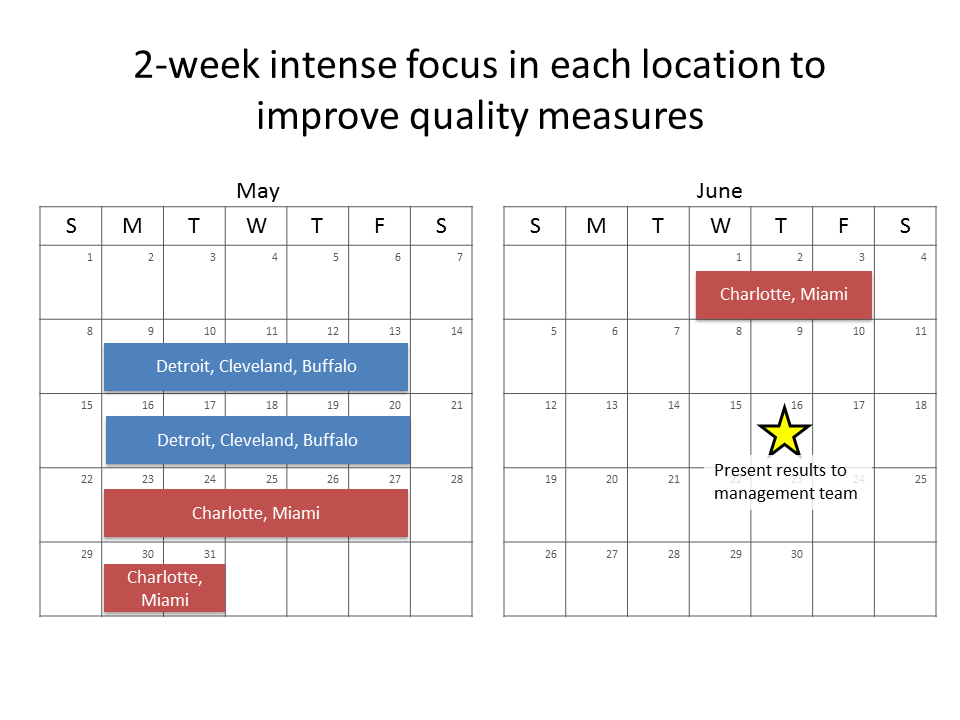
Example: Calendar of events
Start with
Quickly create
Steps to create a calendar of events from one of the monthly calendar visuals: Replace default time segment headings with month abbreviations; add text and rectangles
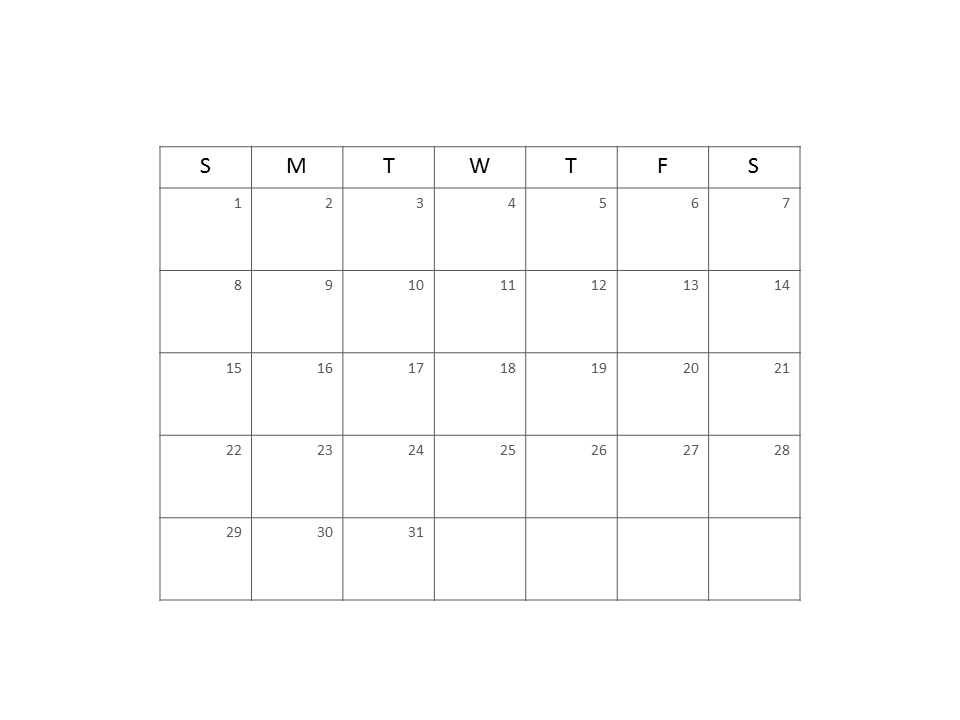
File #3: Daily calendars
Contains days of the month calendars for all possible months. Calendars start on Sunday and end on Saturday (easily changed). Created using a table so all time periods are the same width.
Right-click here to download the file of Daily Calendars
Example: Calendar of activities
Start with
Quickly create
Steps to create a calendar of activities from one of the daily calendar visuals: Use more than one visual on a slide if needed; resize the tables if needed; add month headings; add text and shapes
Create accurate time relationship visuals using graphs in Excel that can be copied to PowerPoint slides
If you need very precise and accurate time relationship visuals you will want to consider creating an Excel graph that can accurately show the exact dates. I have written some articles on some of the visuals you can create using Excel graphs.
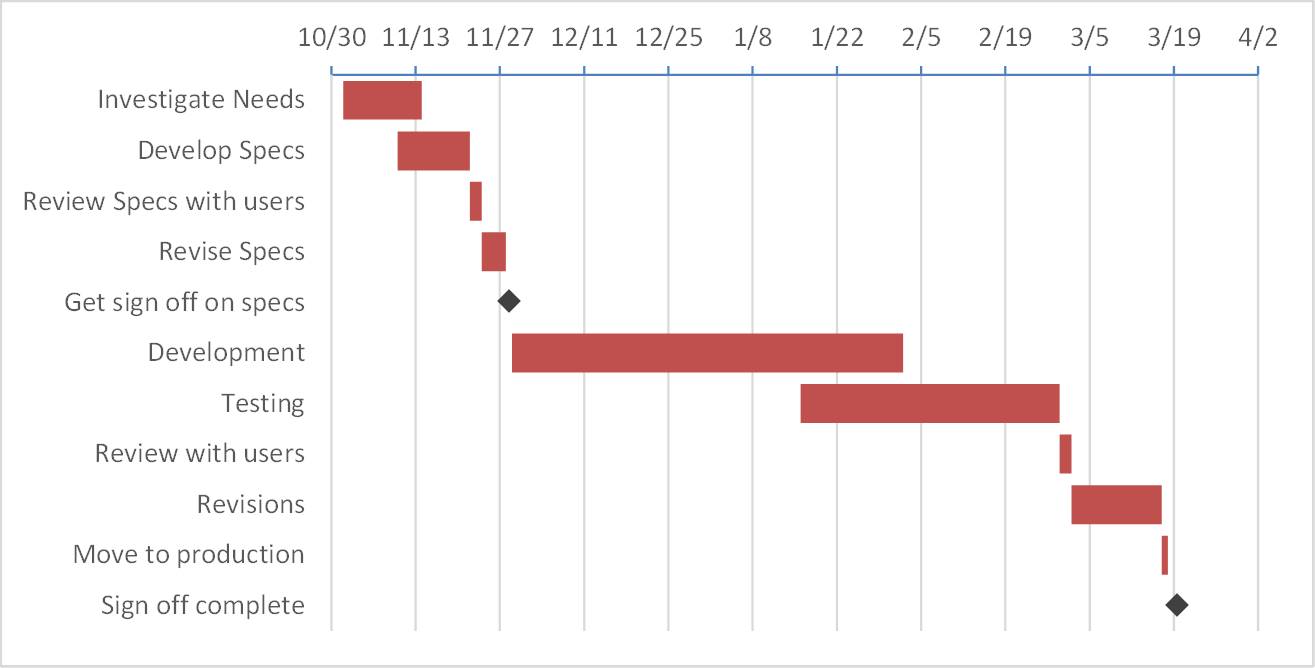
Article #1: Gantt chart with milestones
This article show you how to create a Gantt chart that has the timeline in days and includes milestones. Here is an example of the visual that is created.
Article #2: Monthly Gantt chart with milestones
This article show you how to create a Gantt chart that has the timeline in months and includes milestones. Here is an example of the visual that is created.
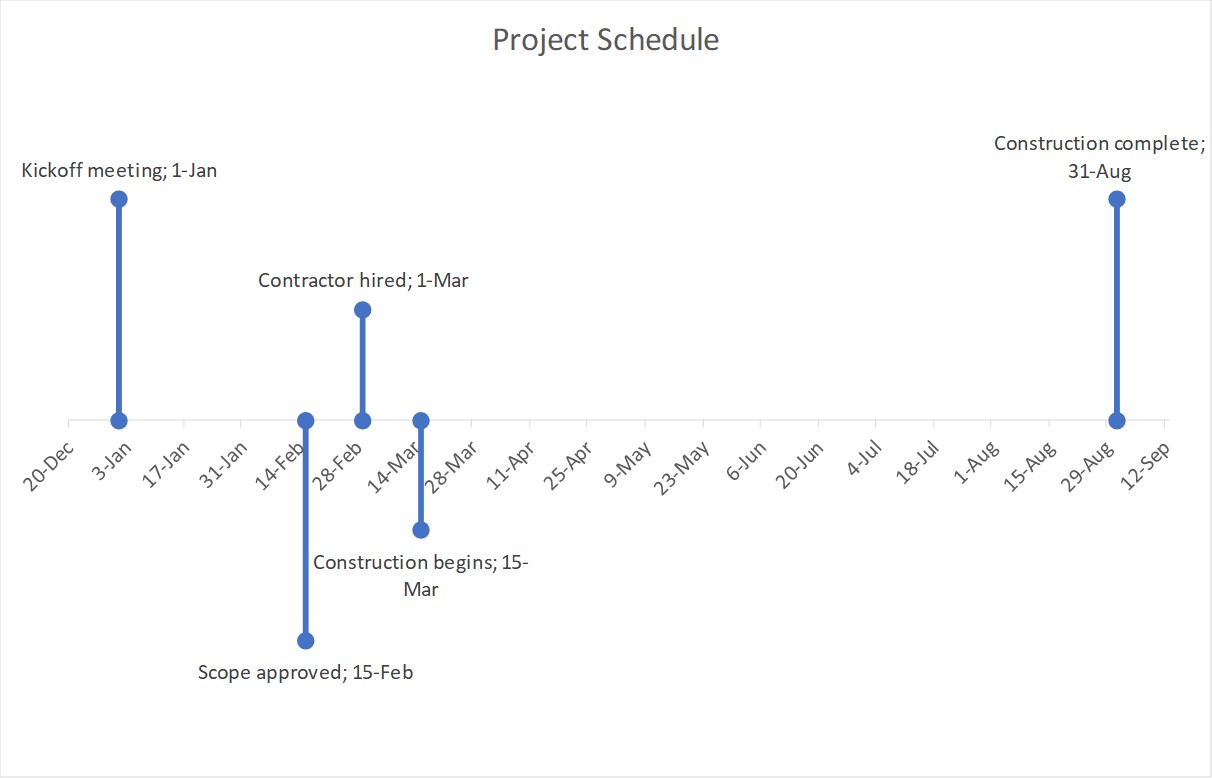
Article #3: Timeline inspired by PowerPoint Design Ideas
This article show you how to create a timeline visuals to show when events occur. The design of the visual is inspired by a visual that PowerPoint’s Design Ideas creates from a list of bullet points that include dates.. Here is an example of the visual that is created.
Article #4: Use Excel templates from Microsoft
This article shows you some of the Excel templates you can download from Microsoft to create timeline visuals.
Video on creating an Excel Timeline chart
Excel MVP Leila Gharani published a great video on how to create a timeline using an Excel chart. It can even update automatically as you add dates. And you can download her file so you can started right away. Check out her video below.
Article on options for copying an Excel chart to a PowerPoint slide
Create a sliding timeline visual in PowerPoint to show many time periods or events
If you have many time periods to show in a timeline visual or you have many events to show on a timeline and cramming it in on a single slide would look too crowded, consider splitting the timeline across two slides. In this article & video you will see how to create a sliding timeline that continues the timeline from one slide to the next so your audience keeps context and follows your explanation. This also allows the text for each event to be larger and easier for the audience to read.
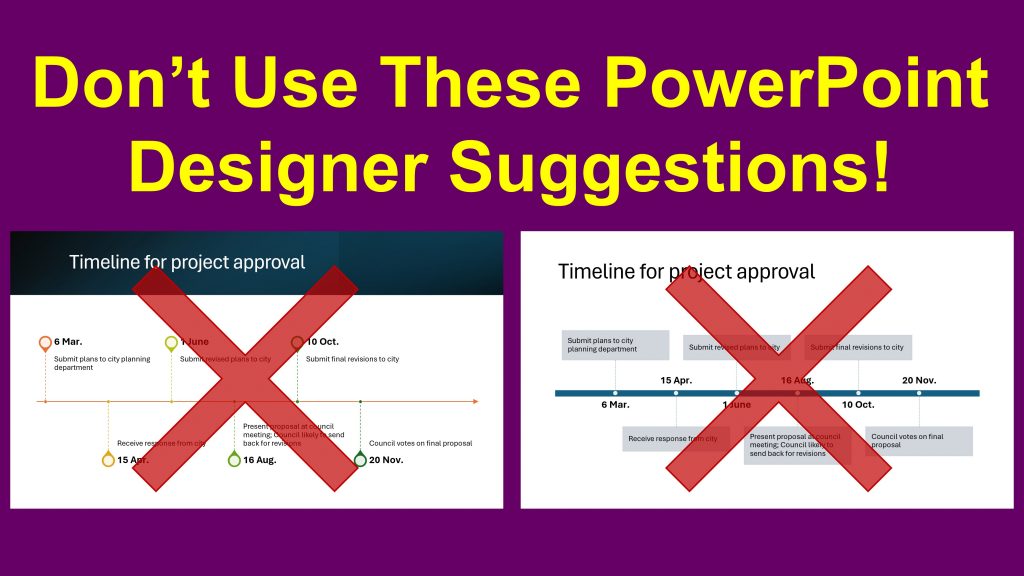
Create an accurate timeline visual in PowerPoint to replace the PowerPoint Designer suggestions
When PowerPoint Designer offers suggestions for a text slide with a list of dates and event descriptions, it offers visuals that have a horizontal line that indicates the timeline and then evenly spaced vertical lines and text that indicate each event. The first problem is that we don’t know what timeframe the horizontal line represents. The second problem is that the events are evenly spaced along the timeline so they do not accurately reflect the timing of the events along the timeline.
In this article & video I show a better visual that presents an accurate timeline to executives and decision-makers. It is created in PowerPoint and the video gives you step-by-step instructions.