Microsoft makes downloadable timeline templates available at https://templates.office.com/en-us/timelines. Note that some of the templates are classified as Premium templates (denoted by the diamond icon) which are only available to those who have a subscription to Microsoft 365.
When looking at these templates, be careful to select a template that creates an accurate time scale. Most of the Word and PowerPoint templates shown do not have accurate time scales, just evenly spaced elements. Even some of the Excel templates are created using text boxes and shapes.
Below are some that use Excel graphs to create the timeline visual so the time scale is automatically accurate. Because these are Excel graphs, you can adjust and customize them to create what you need.
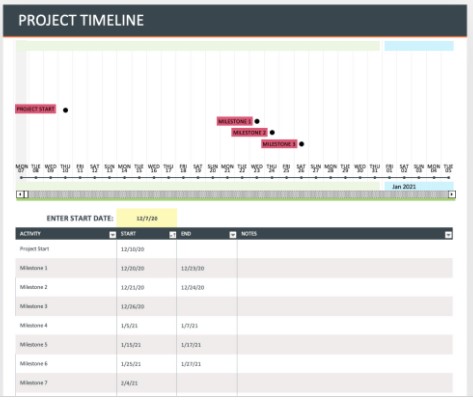
Project timeline template (Premium template)
Link: https://templates.office.com/en-us/project-timeline-tm02930043
This could be a quick way to create a Gantt chart visual.

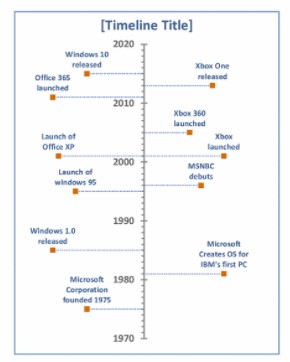
Vertical timeline
Link: https://templates.office.com/en-us/vertical-timeline-tm16400963
I like this visual because it allows you to position which side and how far the event is from the timeline.

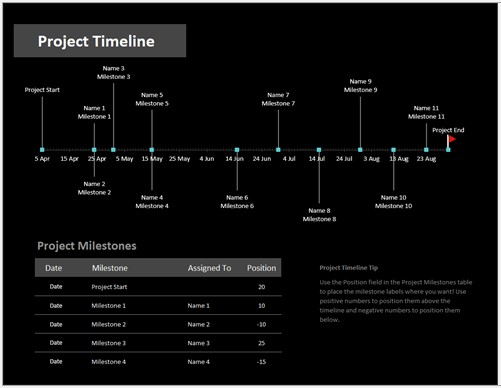
Horizontal timeline
Link: https://templates.office.com/en-us/project-timeline-with-milestones-tm00000009
This is another time visual template that allows you to position event descriptions above or below the timeline.

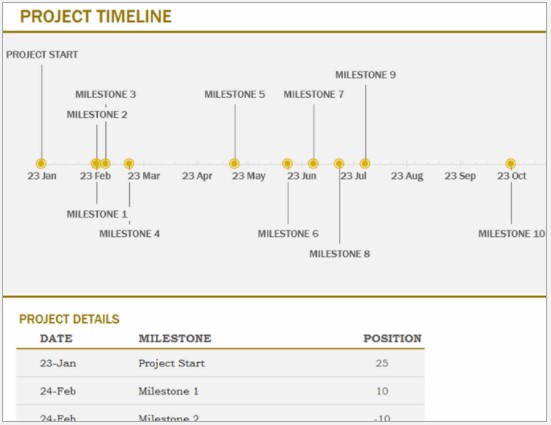
A similar timeline with a different color scheme is at https://templates.office.com/en-us/timeline-with-milestones-yellow-tm03987160

Copying Excel charts to PowerPoint
When you have created the timeline visual in Excel you need to copy it to your PowerPoint slide. This article contains a video that explains two methods when you want the chart linked and a video on two methods if you don’t need the chart linked.
Other pre-made timeline visual resources
One way to reduce the time it takes to create timeline visuals is to use a template or pre-made time scales. Check out the other resources at TimeSlides.com for more pre-made timeline content.

Dave Paradi has over twenty-two years of experience delivering customized training workshops to help business professionals improve their presentations. He has written ten books and over 600 articles on the topic of effective presentations and his ideas have appeared in publications around the world. His focus is on helping corporate professionals visually communicate the messages in their data so they don’t overwhelm and confuse executives. Dave is one of fewer than ten people in North America recognized by Microsoft with the Most Valuable Professional Award for his contributions to the Excel, PowerPoint, and Teams communities. His articles and videos on virtual presenting have been viewed over 4.8 million times and liked over 17,000 times on YouTube.
