One of the examples you see in this video on what people will learn in my workshops on presenting financial and operational data to executives, is a waterfall graph being used to show the components of the change between a starting value and an ending value. After I showed an example of a waterfall graph at a session last November in Vancouver, one of the executives attending immediately saw how much more effective it would be in her presentations. She told me last month that she has seen much better understanding from her audience since she started using this type of visual.
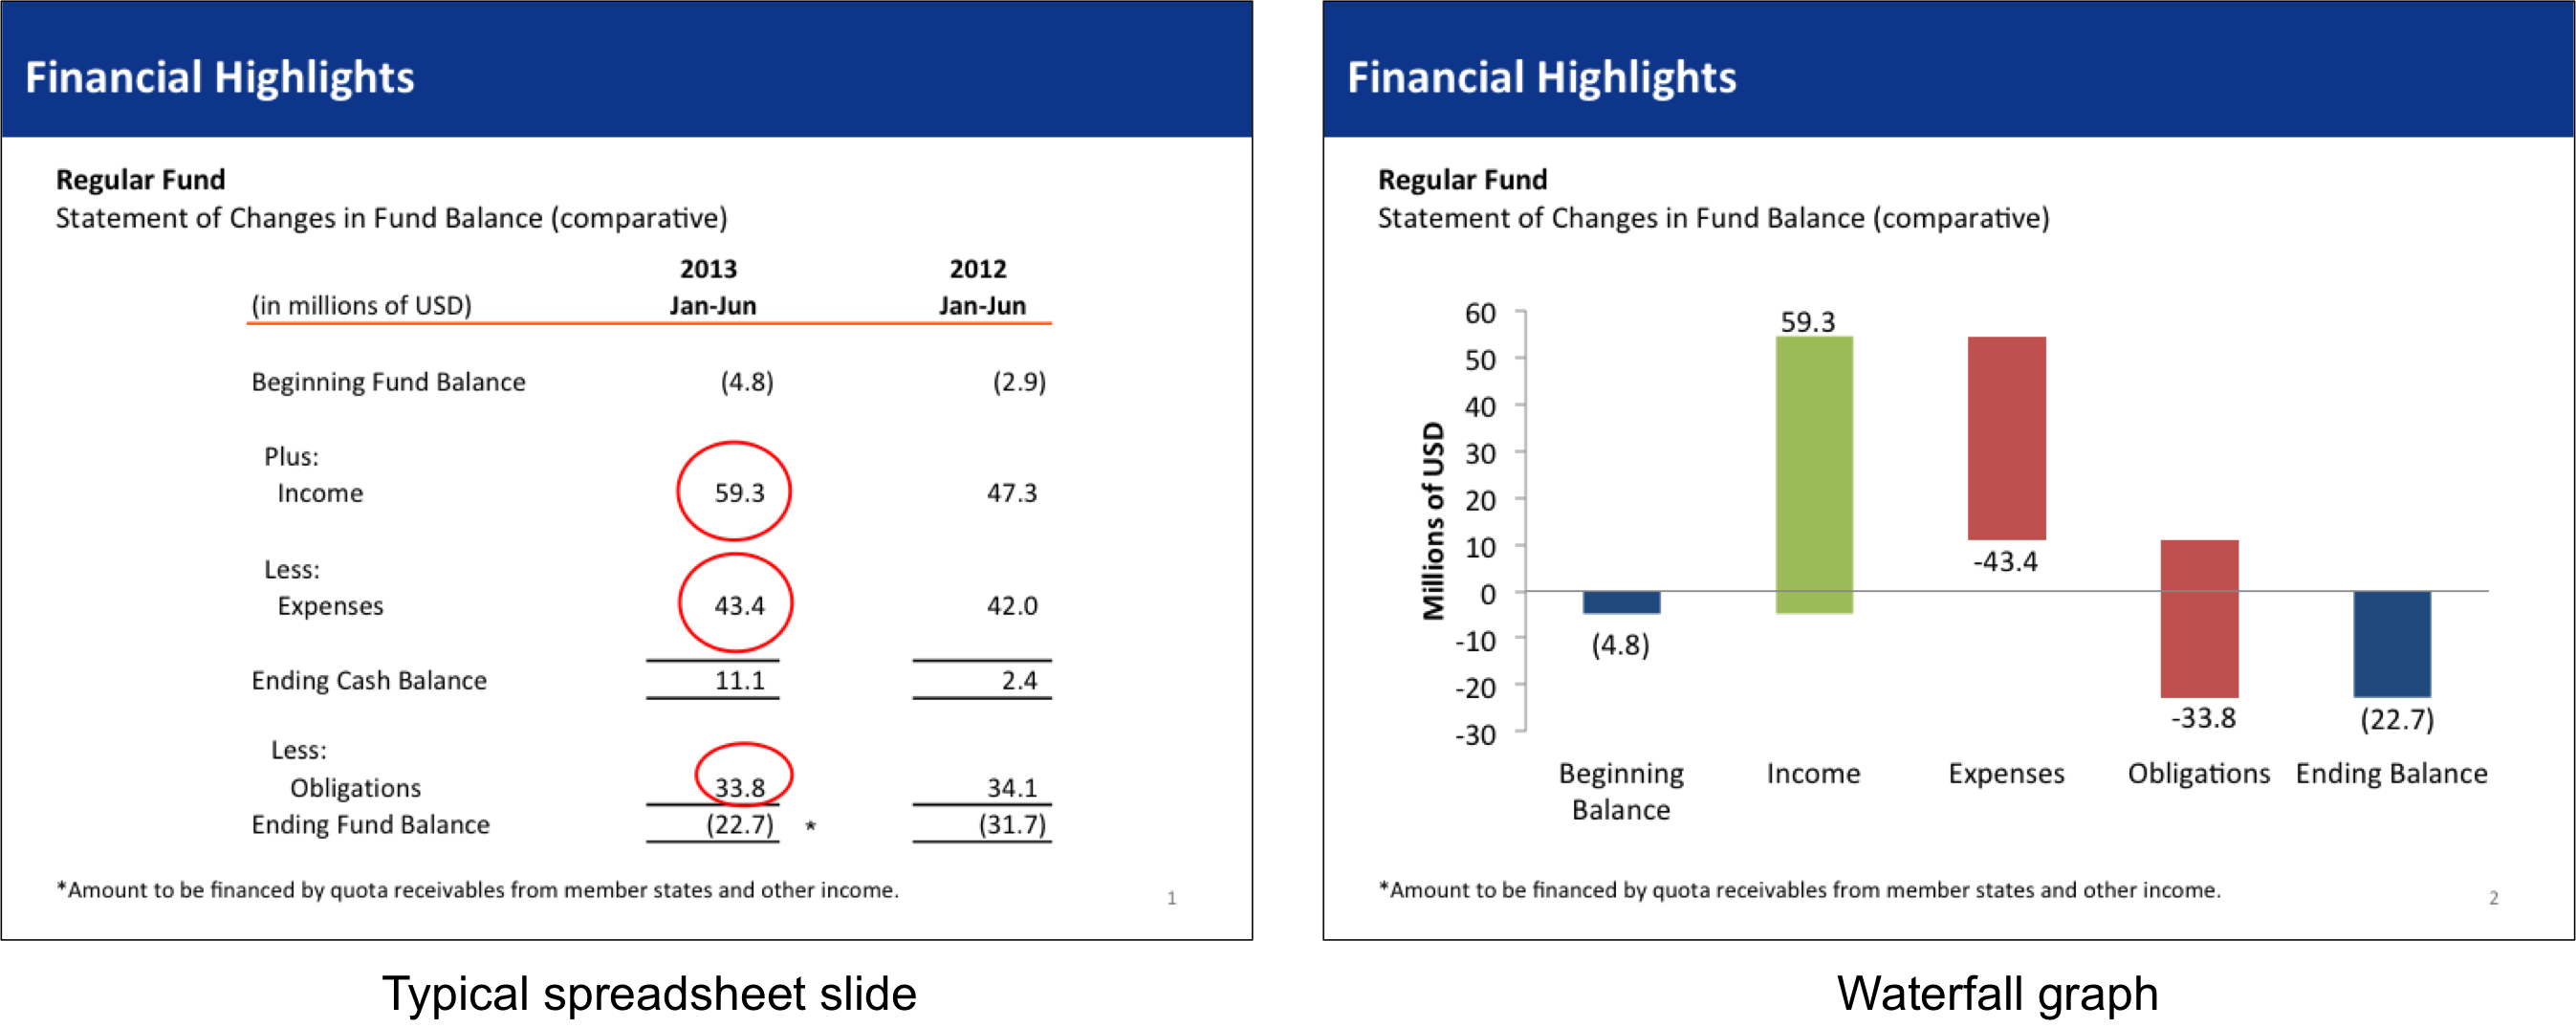
When is a waterfall graph a good choice? Any time you want to show how different components contributed to a movement from a starting value to an ending value. It is often used to show the changes in cash position between the start and end of the year. It is also used to show what contributed to a change between a projected amount and the final approved amount. This visual works better than the typical spreadsheet that is used. Here is the before and after slides that I used in the video above.
Many people find a waterfall graph hard to create. And it is if you have to do the calculations manually. The easiest way to create a waterfall graph is to use a stacked column graph, where one segment is set to no fill and no outline. This invisible segment “supports” the segment that appears to float above the horizontal axis.
After helping a presentation designer determine that a waterfall graph would be the best visual to use in a project last year, I realized that she would have to do some manual calculations to create the visual. So I created an online calculator that makes all of the calculations easy.
Go to www.WaterfallGraphCalculator.com and you will see how easy it is. You enter the starting value and each of the components (positive or negative). The calculator creates a table that you just copy into the data table for the graph in PowerPoint. I have added some tips for creating the graph in PowerPoint on the page below the calculator. I also have a video that shows the basic steps in PowerPoint (the video was done a couple of years before I created the calculator).
In my What Visual To Use tool, I have a number of different examples of waterfall graphs as well as a variation of this type of visual I call a Steps to a Total graph. You can register for free to check it out or sign up for the 10 days for $10 access to use the full information in a presentation project.
If you present financial information that includes explaining the components that contributed to a change between a starting and ending amount, use a waterfall graph visual instead of a spreadsheet.
Get a free ebook on How to Present your Excel data effectively to Executives
If you want to comment on this article, you can do so below using Google+. I have started using the Google+ system to manage comments because it cuts down on the spam comments that many blogs are subject to. Just sign in using your Google account (the one you use for Gmail, YouTube, or any other Google service) and you can add your thoughts.

Dave Paradi has over twenty-two years of experience delivering customized training workshops to help business professionals improve their presentations. He has written ten books and over 600 articles on the topic of effective presentations and his ideas have appeared in publications around the world. His focus is on helping corporate professionals visually communicate the messages in their data so they don’t overwhelm and confuse executives. Dave is one of fewer than ten people in North America recognized by Microsoft with the Most Valuable Professional Award for his contributions to the Excel, PowerPoint, and Teams communities. His articles and videos on virtual presenting have been viewed over 4.8 million times and liked over 17,000 times on YouTube.