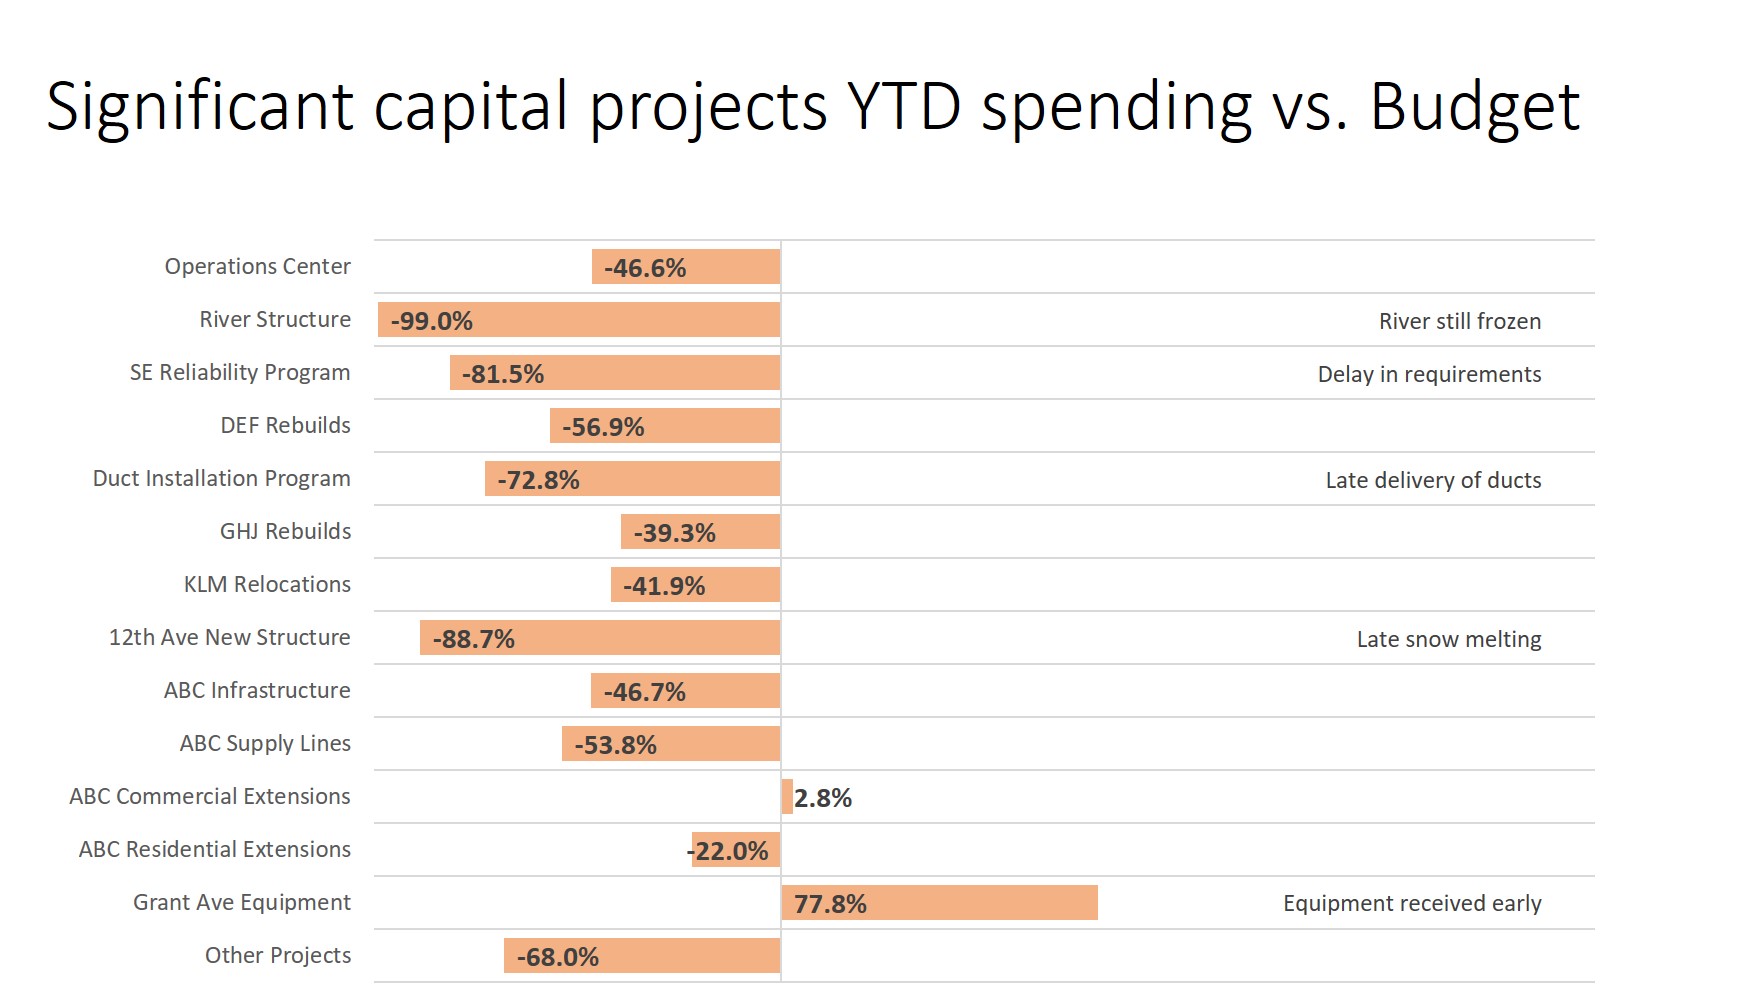
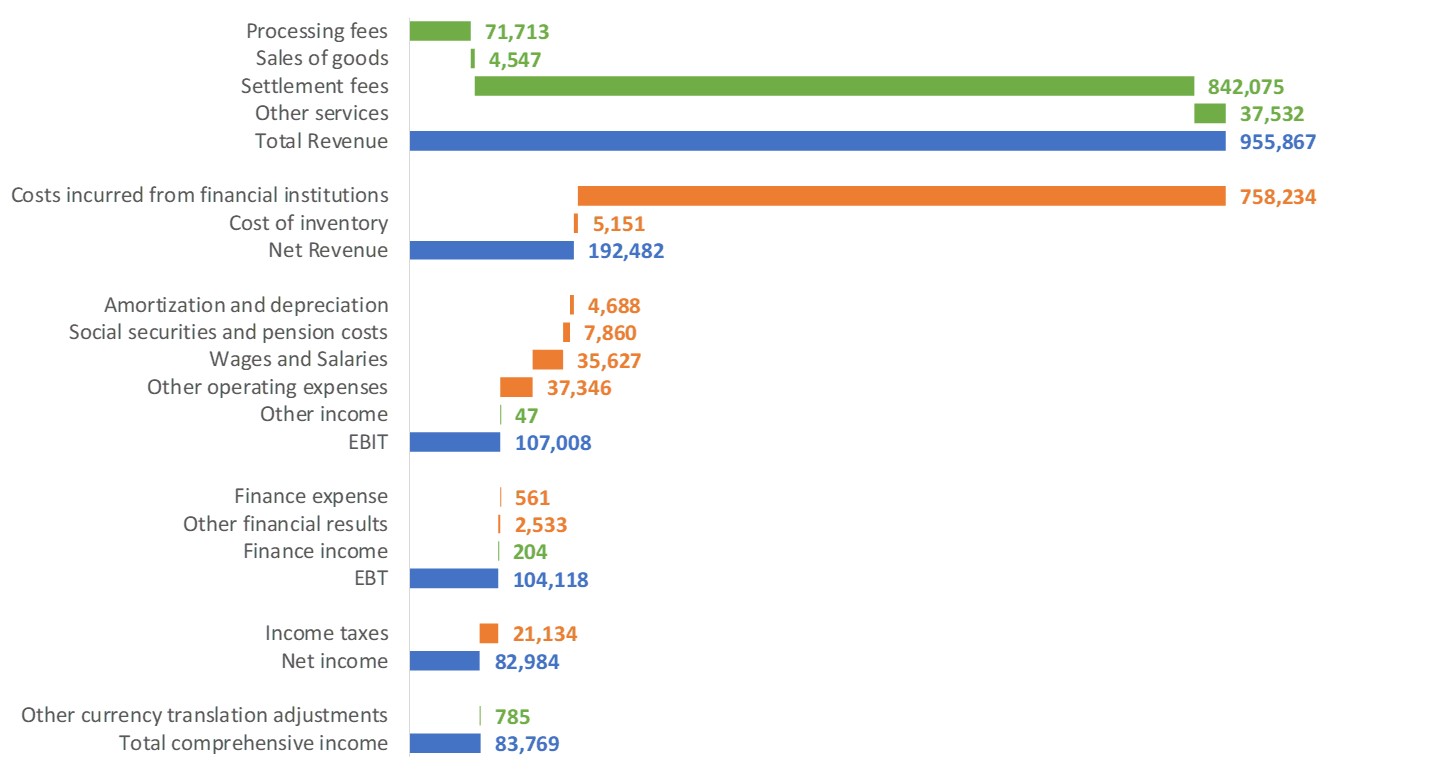
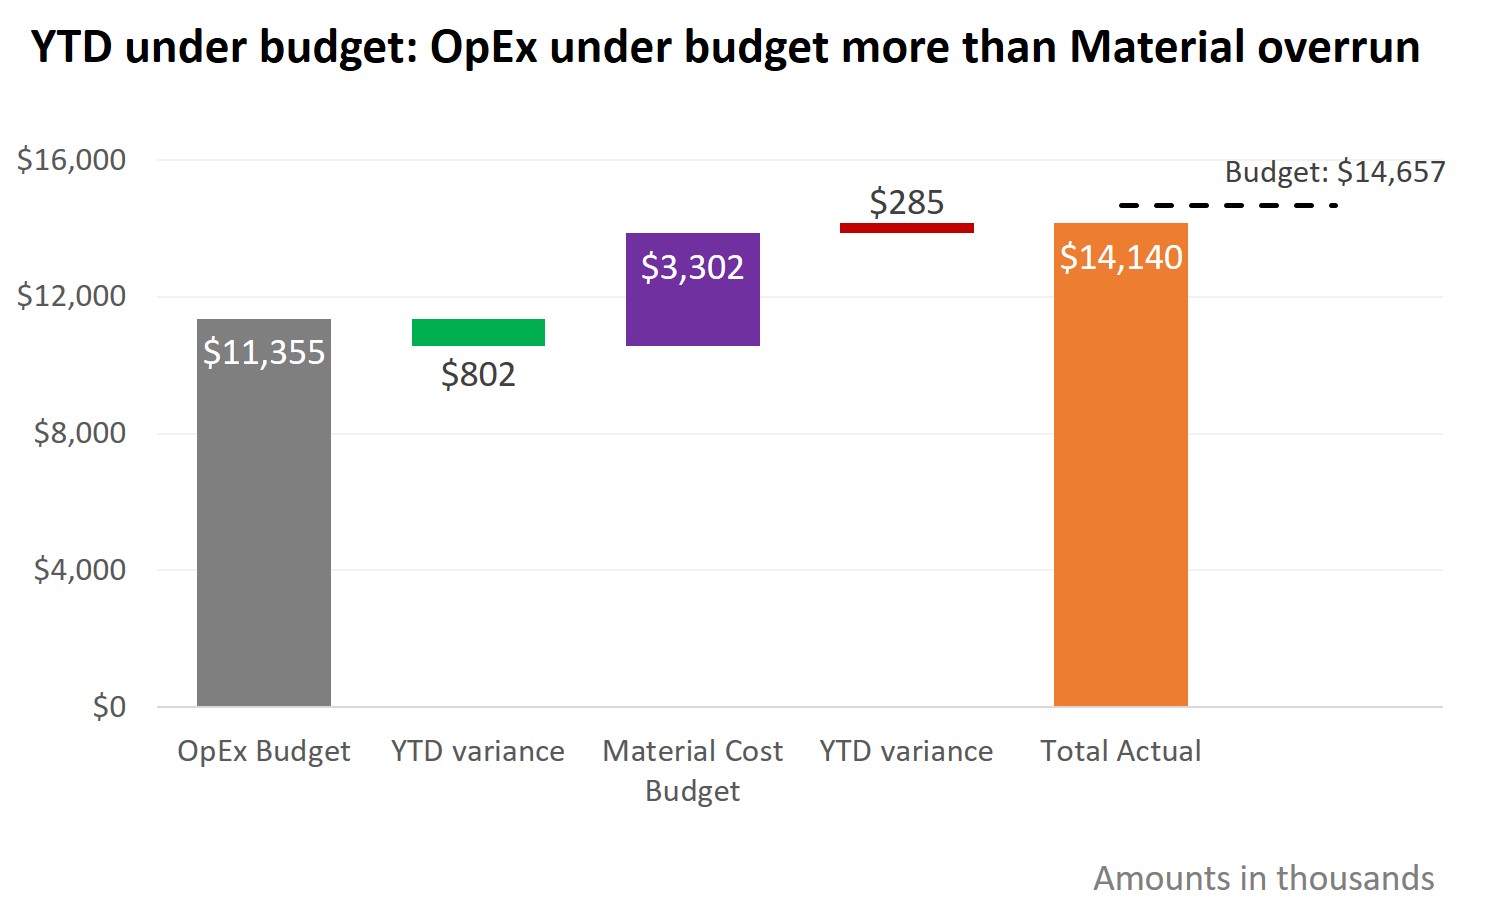
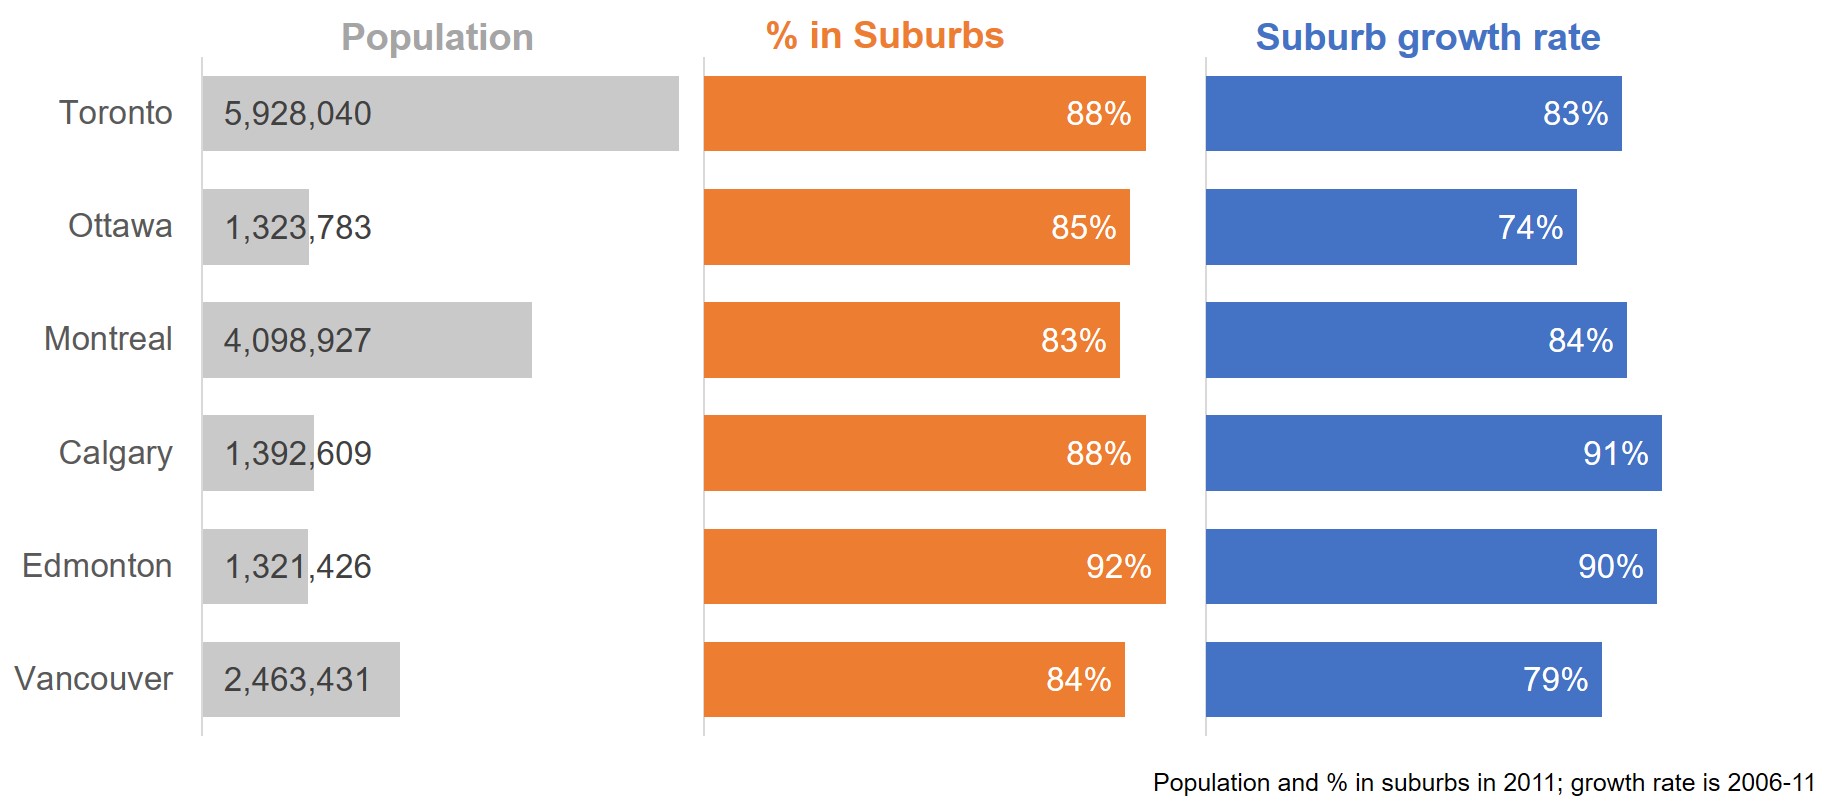
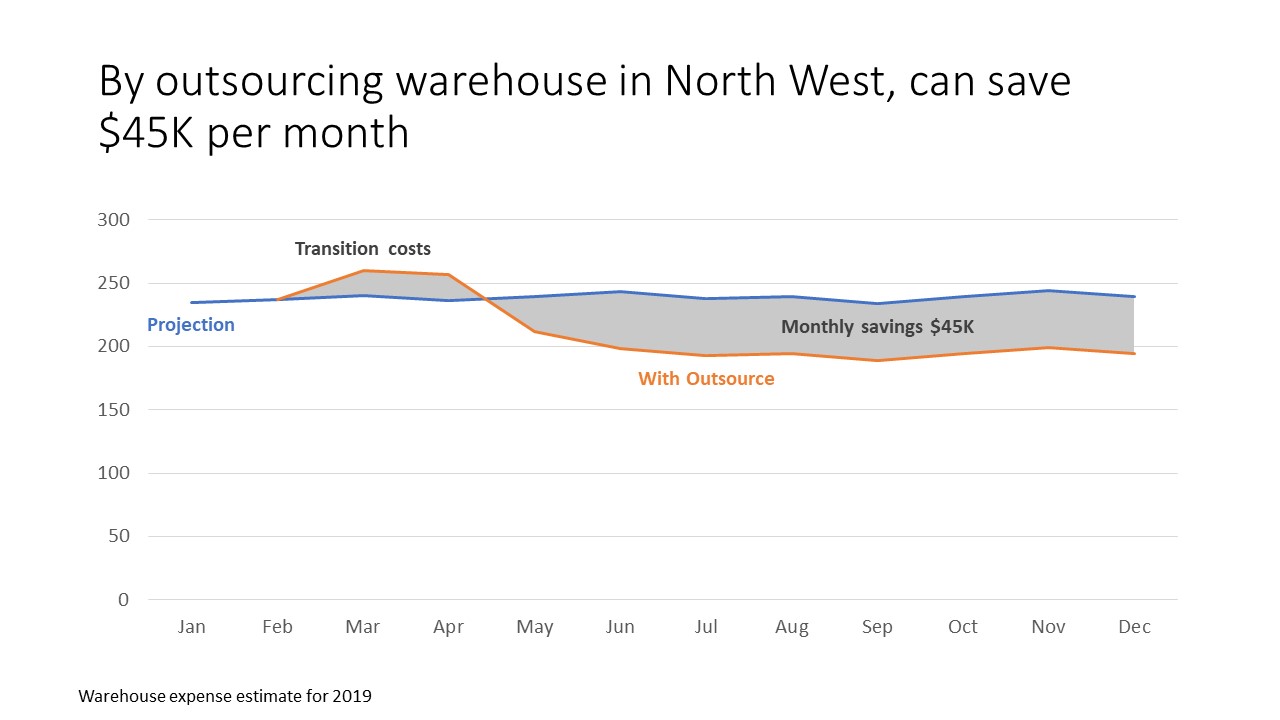
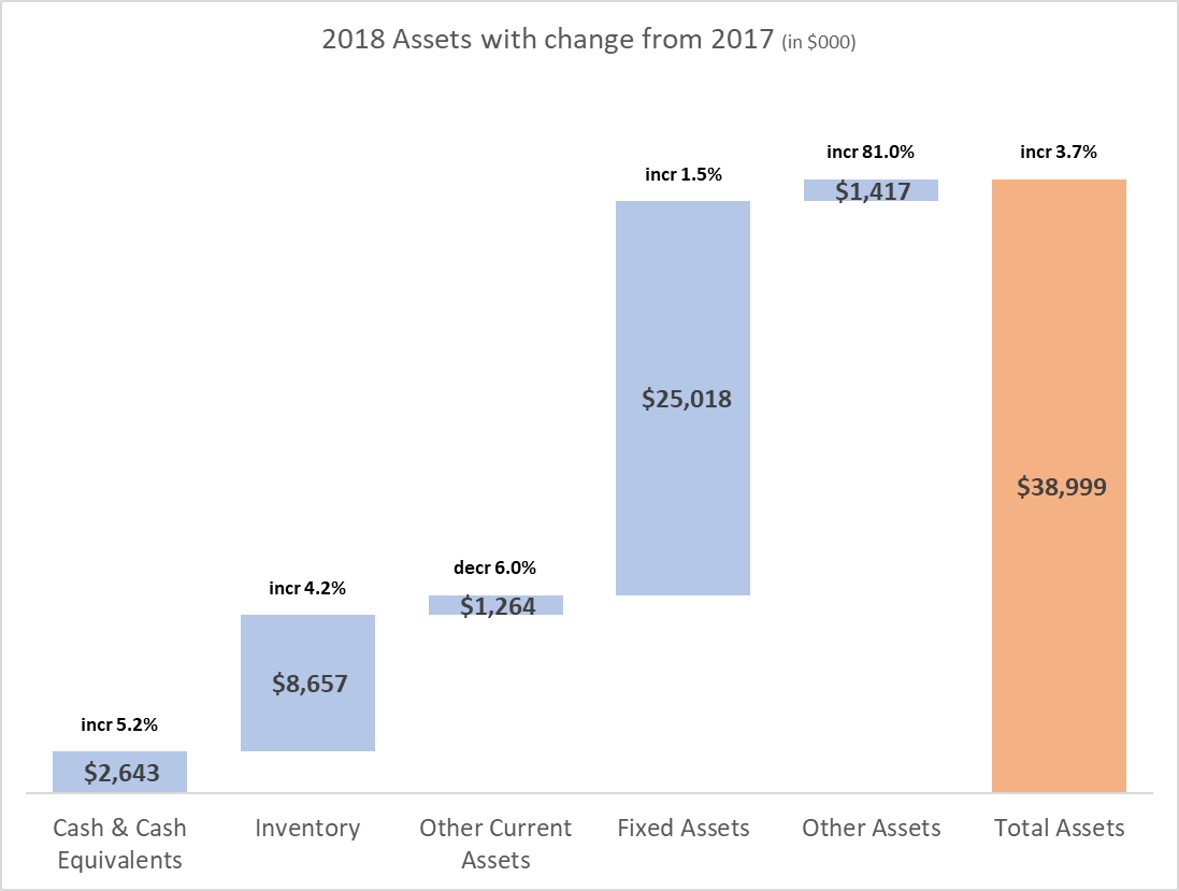
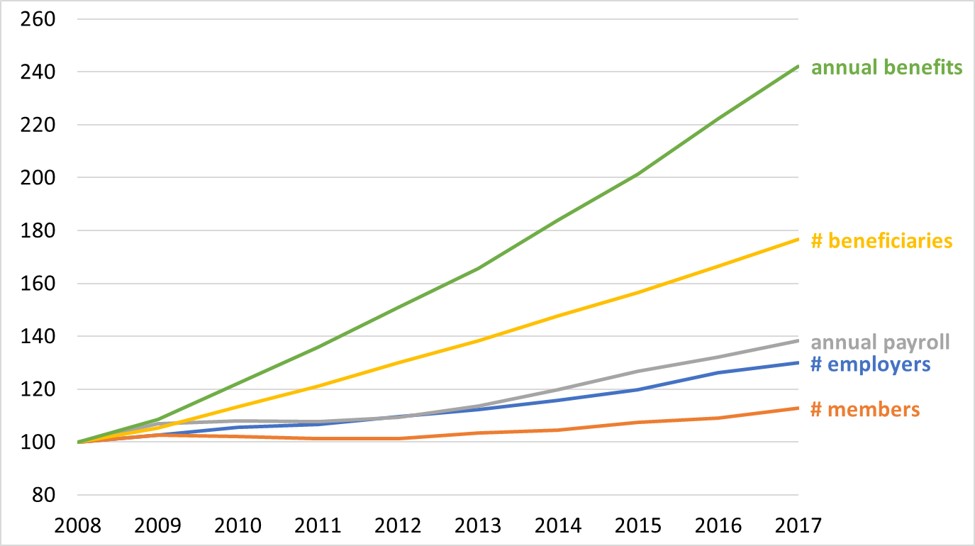
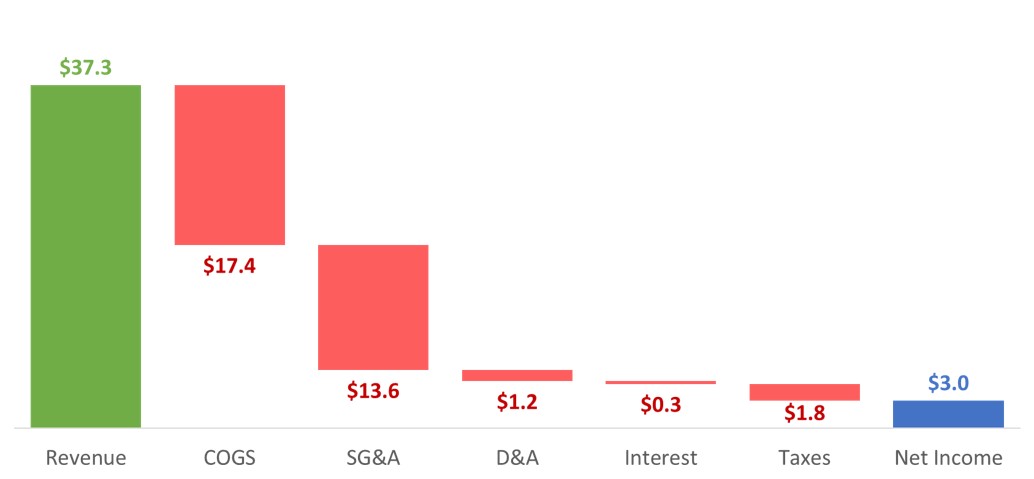
FinancialViz Examples by date Lessons in creating effective Excel charts from the October 2019 SWD Challenge Comparing actual to budget with explanations; Slide Makeover #95 Visualizing Net Income from Inflows and Outflows; Issue #443 July 9 2019 Showing component and total variance to budget; Slide Makeover #94 FinancialViz Makeover: Comparing multiple characteristics Showing future differences; Issue #433 February 19 2019 Presenting the Balance Sheet: Visually show Assets (or Liabilities) with YoY change Comparing only one value to a standard; Issue #432 February 5 2019 Presenting financial analysis: Show trends in data series measured in different units Presenting the income or P&L statement: Show how revenue less expenses results in net income Previous Page 1 2 3 4 5 … 8 Next Page