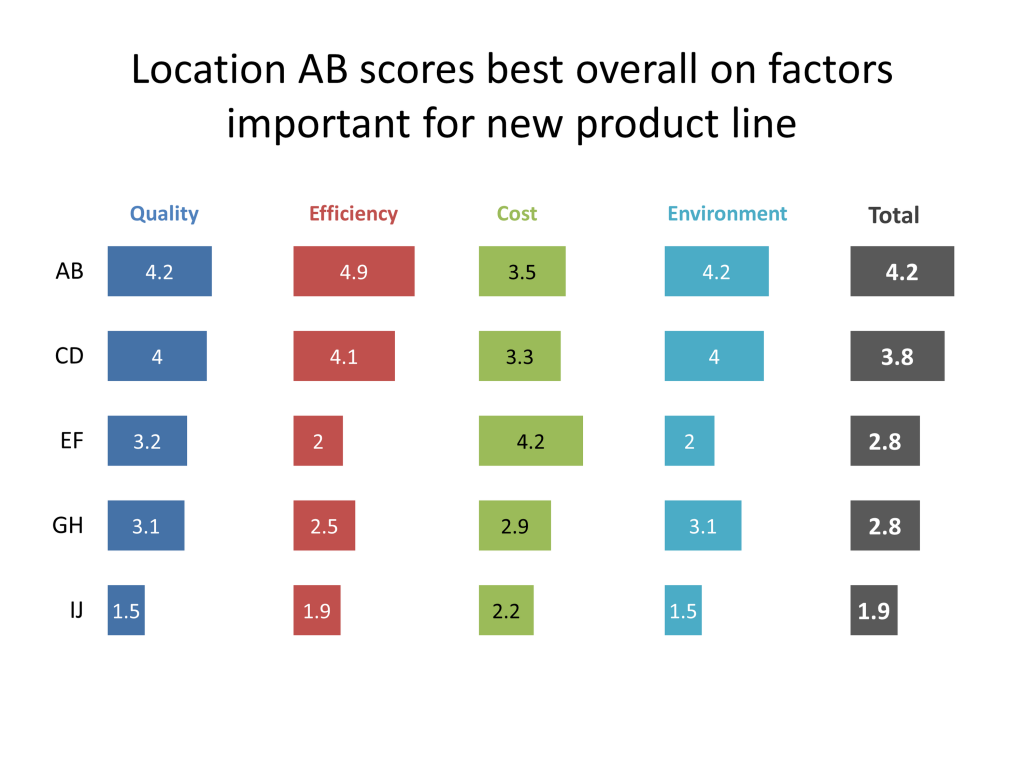
A small multiples visual is a collection of column graphs or bar charts arranged so that you can compare multiple data series more easily. It replaces charts such as those that have multiple columns or bars beside each other, stacked columns, or even multi-segmented donut charts. This article shows how a small multiple bar chart made the data easier to understand than the visuals that two major newspapers had created. This article shows a makeover I did that used small multiple bar charts.
Here is an example that shows how different locations rate on the important criteria used to evaluate them on a five point scale. The locations are ordered by the total score on the right.
While this looks like a difficult visual to create, the secret is that it is actually one stacked bar chart that has spacer segments to separate the different graphs. Those spacer segments are set to have No Fill and No Line so they are invisible.
The calculator you can download below will allow you to input the categories and labels for up to six graphs. You also set the maximum value for each graph and the space between the graphs. The calculator creates a Results table that you can use in Excel or PowerPoint. Just copy the results table into a stacked column or stacked bar graph and set the spacer segments to be invisible. The calculator contains two sample graphs so you can see what they look like and it contains more formatting tips. It is part of my Calculators For Visuals Excel file that you can download.
Right-click on this link and select to Save the file to your computer. Then open the file you have downloaded in Excel.

