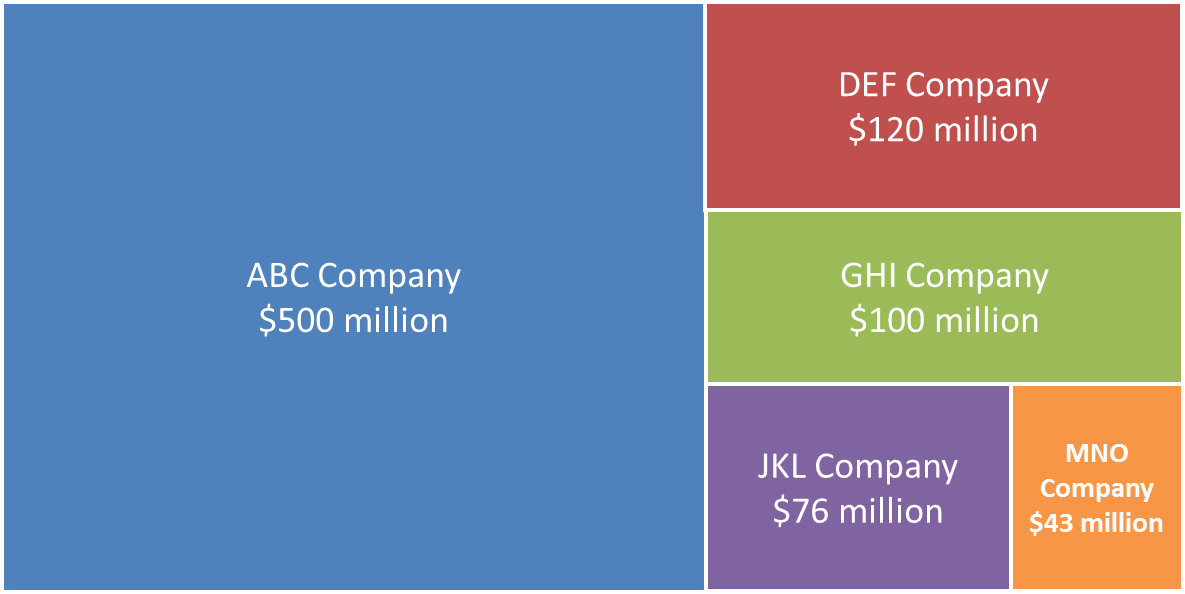
A treemap is a type of visual that allows you to visually compare the size of different measured values using proportionally shaped rectangles that are arranged into an overall rectangle. Here is a link to an article that contains more on the background of this type of visual. It is an alternative to a graph and can work well if you have one value that is over 50% of the total of all values. Here is an example of a treemap.
To make the calculations easier, I have created a calculator for you. It is part of my Calculators For Visuals Excel file that you can download.
Right-click on this link and select to Save the file to your computer. Then open the file you have downloaded in Excel.
Thanks to Nolan Haims of presentyourstory.com for the inspiration to create this calculator.