Once you have decided on what information you will include in your presentation using the ideas in the first two lessons of this e-course, you can then decide how to support your message with slides. Presentation software, whether it is PowerPoint or any other software, is only a tool you can use to create effective slides. The software won’t create the slides on its own.
The default slide layout for PowerPoint is a title with a series of bullet points below. While I am not opposed to using text slides, I don’t think that this default inspires you to think of what the best visual would be to support each point. Step away from the computer and grab a pen and paper. I know that may seem “old school”, but it really is the best way to plan your slides.
Here’s why. You need to separate the thinking about the slides from the mechanics of creating the slides. If you are working in PowerPoint, you get bogged down by the mechanics of creating a slide. Your thinking gets interrupted or even replaced by the work of finding the right tool, how to use it and details like colors and fonts. By stepping away from the computer, you focus on thinking about what visual would best support your message, and you will come up with better ideas.
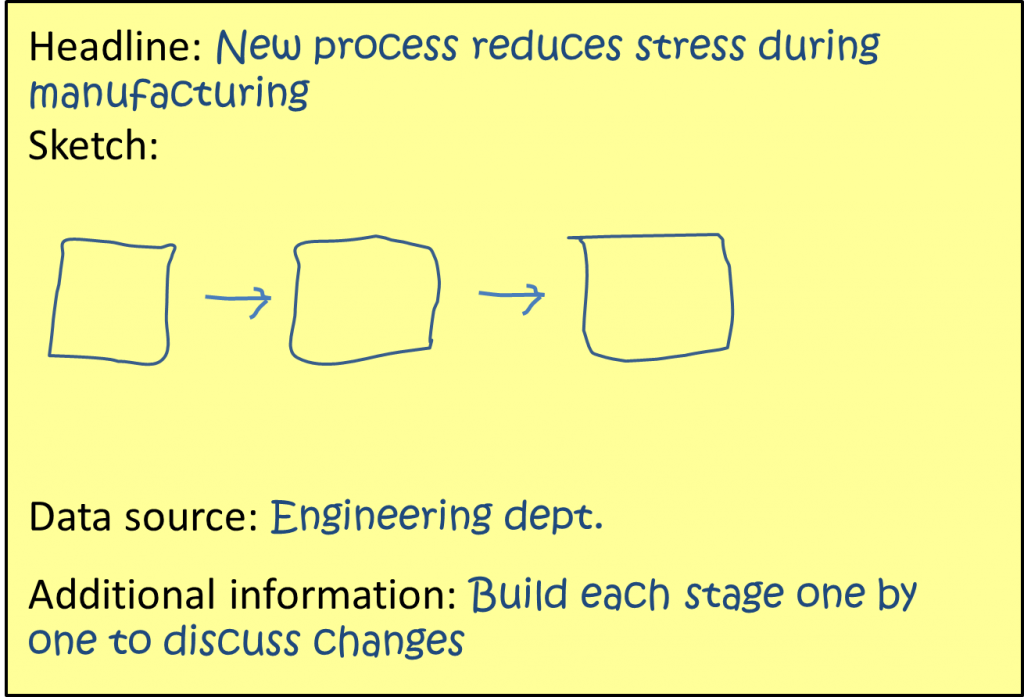
Here is how you can plan each slide on paper (or a large sticky note):
Step 1: Write a headline
Start by writing a headline for your slide. A headline summarizes the key point you want the audience to remember from the slide. This focuses the audience on the single point you want them to understand (remember how we talked about only one point per slide in the last lesson). A headline also makes it easier for you as the presenter because you know the one message you need to communicate on this slide and then you can move on.
Step 2: Sketch the visual
Next, sketch out the visual you think would best illustrate the point you are making. It might be a graph showing a trend. It might be a process diagram as the example above shows. It might be a photo of a product or part. It might be a few text points. Whatever visual you have decided on, just sketch it out. You don’t need any artistic talent to do this.
Step 3: Determine the data source
Third, note where you will be getting the data or what the source of the visual is. It may be a data set that needs to be analyzed, a report, an interview with someone, a diagram from another department, a government research source, or any other source that will lend credibility to the visual.
Step 4: Additional information
Finally, note any build sequences or other notes to remember when creating the slide in software.
By planning your slides this way, you make it much easier to create the slides. You can hand the paper off to someone else or create the slides yourself. Either way, you will find that you spend far less time in the software because you have already done the thinking and now you can just focus on the mechanics of constructing the slide.
Here are some additional articles that will help you plan the slides for your presentation:
Create presentation visuals based on lessons from grade school
Design visuals vs. Content visuals
Identify the best visual by looking for clues in the words you use
Listen to the word pictures you paint to determine visuals for your slides
This is one of the lessons in my free seven day e-course that will help you create more effective PowerPoint presentations. If you reached this page from a web search, you can sign up to get all seven e-mails delivered to your Inbox by filling in the information in the form located at the top right of this page.

Dave Paradi has over twenty-two years of experience delivering customized training workshops to help business professionals improve their presentations. He has written ten books and over 600 articles on the topic of effective presentations and his ideas have appeared in publications around the world. His focus is on helping corporate professionals visually communicate the messages in their data so they don’t overwhelm and confuse executives. Dave is one of fewer than ten people in North America recognized by Microsoft with the Most Valuable Professional Award for his contributions to the Excel, PowerPoint, and Teams communities. His articles and videos on virtual presenting have been viewed over 4.8 million times and liked over 17,000 times on YouTube.

