Participants in my customized workshops often find the makeovers I’ve done of their own slides the most impactful part of the session. The makeovers demonstrate how the ideas apply to the presentations they create and deliver. How do I know when to select a specific type of visual? I explain my entire process in my book Select Effective Visuals and today I want to focus on some clues I use to identify that a sequence or time based diagram will work well to communicate the message of the slide.
Clues that one of these types of visuals will work well are often in the title or content of the existing slide. The slide will usually contain mostly text in bullet points and a short title. I look at these words for the clues.
Sequence Visuals
For sequence visuals, some of the clues I often find are words such as: “process”, “steps”, “phases”, “cycle”, “start/end”, “loop”, or “flow”. These words suggest a sequence of tasks or steps that are proposed or need to be followed. When I see these word clues I think of visuals such as the following, all of which are from recent customized workshops.
This slide had the word “process” in the title and identified the steps that the organization goes through to evaluate and deal with risks to cyber assets. The chevron sequence diagram shows each step and how we move through the steps.
![]()
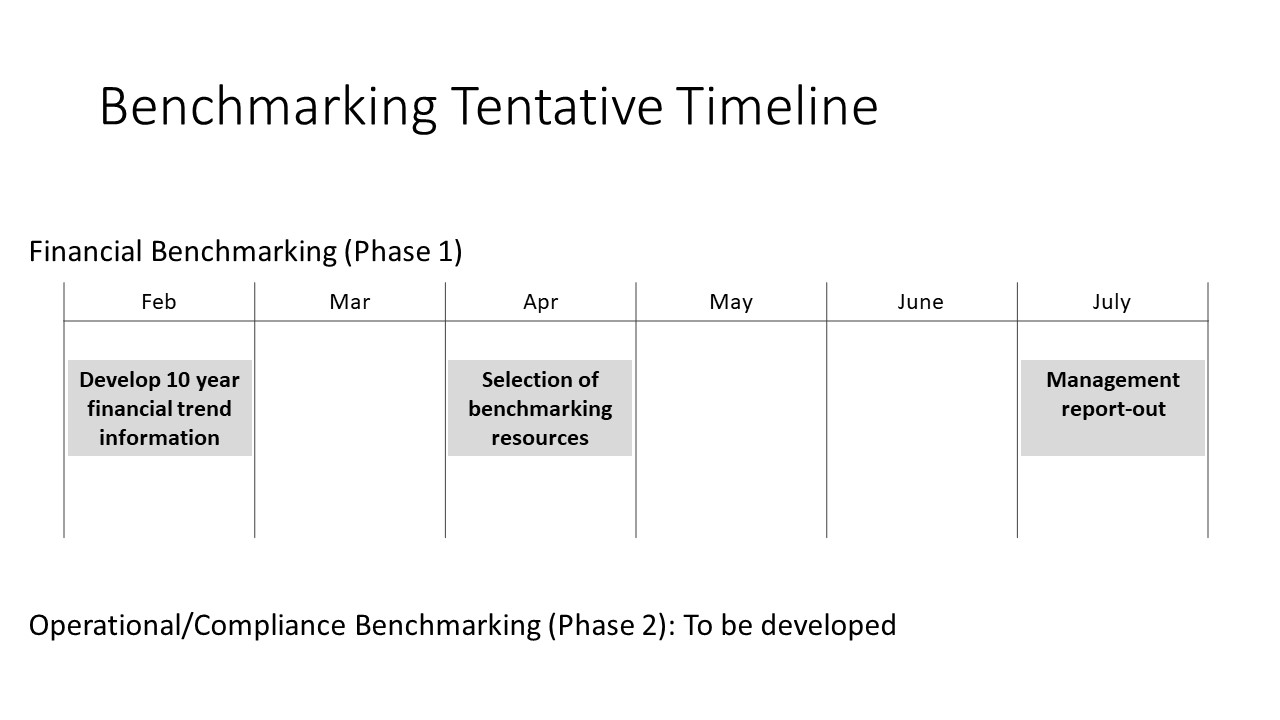
This slide is a common slide near the end of a presentation where we are informing the audience of the next steps and perhaps getting approval or agreement to these steps. It started as the typical list of bullet points but the chevron sequence visual makes it clearer that this is a sequence of steps with some suggested timeframes.
![]()
This slide has the words “process” and “flow” in the title and indicated a cyclical sequence where some equipment is cleaned after use and returned to service to be used again. The rectangular shapes on top of the circular arrow help to visually show this continuous sequence.
![]()
Time-based visuals
For time-based visuals the clues can be words such as: “timeline”, “dates”, “timing”, or “schedule”. Clues for a time-based visual can also be a list of dates or text that indicates days, weeks, months, or years. When I see these clues I show how a time-based visual like the following examples from recent customized workshops can more effectively communicate the message.
This slide has the word “timeline” in the title and started as paragraphs of text that described when each task would take place. A Gantt chart visual shows how long each step will take and when it is scheduled to be undertaken.
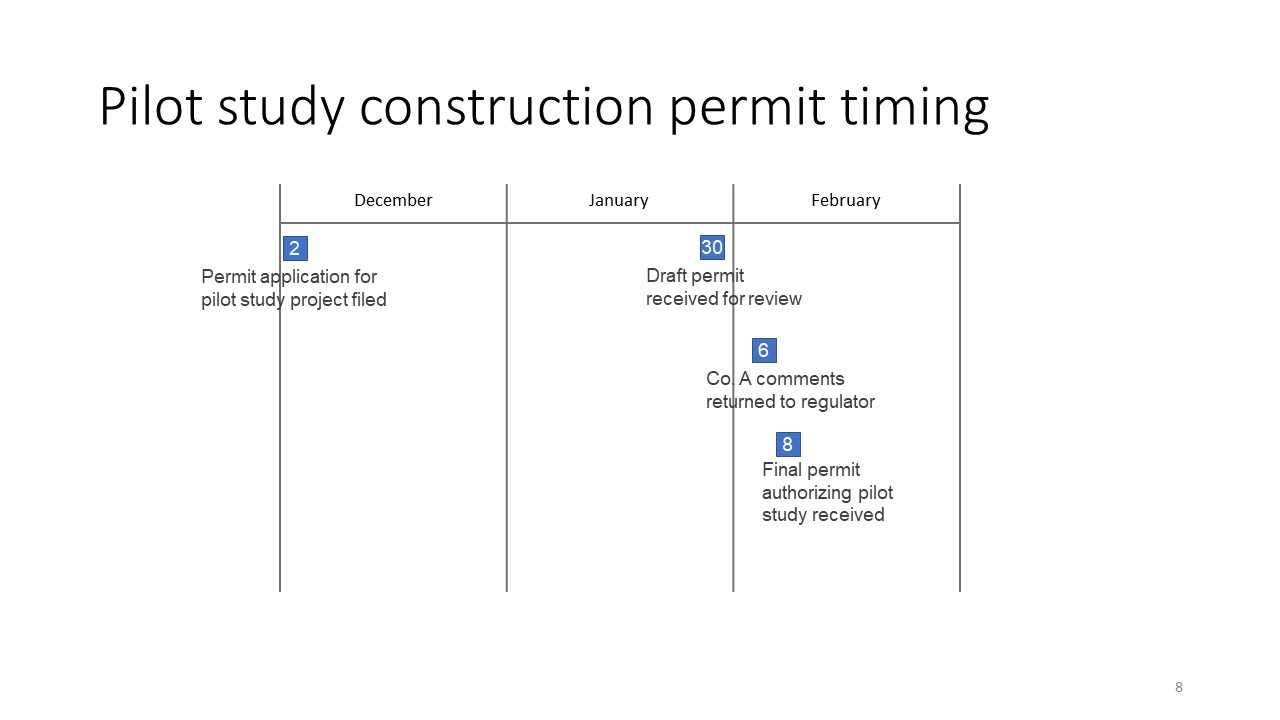
This slide had the word “timing” in the title and was a bullet list of dates with what had to be completed by that date. A timeline visual shows the spread of deadlines within the three month period.
If you want to create a time-based visual, you can start with pre-made timelines and calendars I have available for free download from the TimeSlides.com page on my site.
When you want to use visuals instead of just text for sequence or time-based messages, look for the clues in your existing slides that can help you identify the opportunities to convert text lists into diagrams.

Dave Paradi has over twenty-two years of experience delivering customized training workshops to help business professionals improve their presentations. He has written ten books and over 600 articles on the topic of effective presentations and his ideas have appeared in publications around the world. His focus is on helping corporate professionals visually communicate the messages in their data so they don’t overwhelm and confuse executives. Dave is one of fewer than ten people in North America recognized by Microsoft with the Most Valuable Professional Award for his contributions to the Excel, PowerPoint, and Teams communities. His articles and videos on virtual presenting have been viewed over 4.8 million times and liked over 17,000 times on YouTube.