In my Twitter feed I saw a number of well respected data visualization experts liking a recent article by RJ Andrews for the Data Visualization Society. In it he talks about the issue of starting the axis of a graph at a value other than zero. This is a common topic in the dataviz world and I wrote about it in the past with one suggested alternative.
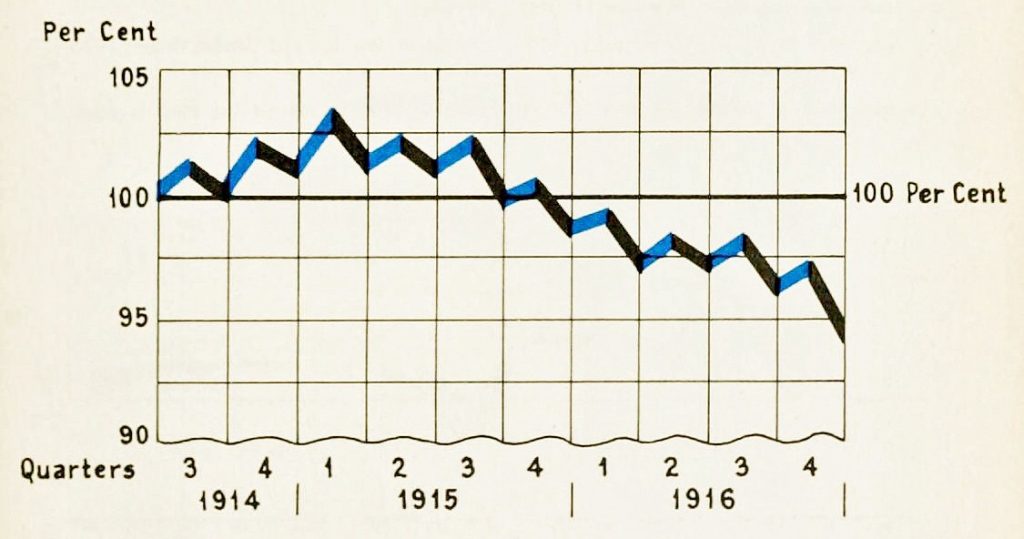
In the article he offers an alternative drawn from the work of Willard Cope Brinton over 100 years ago. The issue of non-zero axes is not new and the solution Brinton offers is to create a graph that does not start at zero but has a bottom edge that looks like a torn piece of paper. This visually clues the viewer in that this is not a usual graph with a standard axis. In the article he shares this example from Brinton’s 1939 book “Graphic Presentation”.
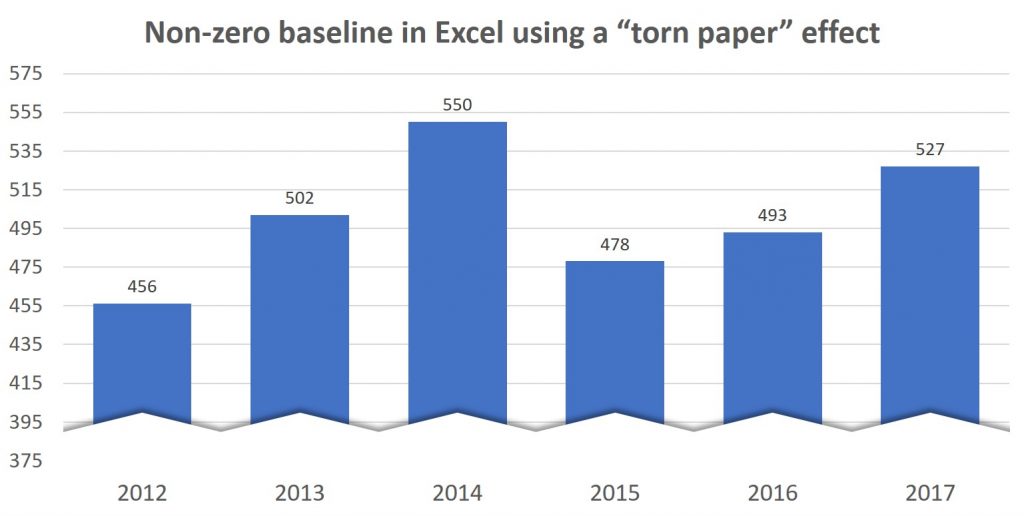
I like this idea and started to think about how we can create this look in Excel. After some experimenting, I discovered that it can be done. Here’s an example of the technique used on a column graph.
The “torn paper” edge is created using a scatter with straight lines graph that uses a very thick white line and a shadow to make the top edge visible. I created a video to show how this is done for column or line graphs.
When you want to use a non-zero baseline for a column or line graph, consider this “torn paper” technique as an alternative.

Dave Paradi has over twenty-two years of experience delivering customized training workshops to help business professionals improve their presentations. He has written ten books and over 600 articles on the topic of effective presentations and his ideas have appeared in publications around the world. His focus is on helping corporate professionals visually communicate the messages in their data so they don’t overwhelm and confuse executives. Dave is one of fewer than ten people in North America recognized by Microsoft with the Most Valuable Professional Award for his contributions to the Excel, PowerPoint, and Teams communities. His articles and videos on virtual presenting have been viewed over 4.8 million times and liked over 17,000 times on YouTube.


