When you are trying to convince a decision maker that the solution you are proposing will solve their problem, using a case study can be an effective way to support your message. In this article I shared the four steps I think every case study should have: 1) Describe the problem and how it is similar, 2) Measure the size of the problem, 3) Provide an overview of the solution, and 4) Show the benefit of your solution. In today’s article I want to share some visuals that would be helpful in each of the steps.
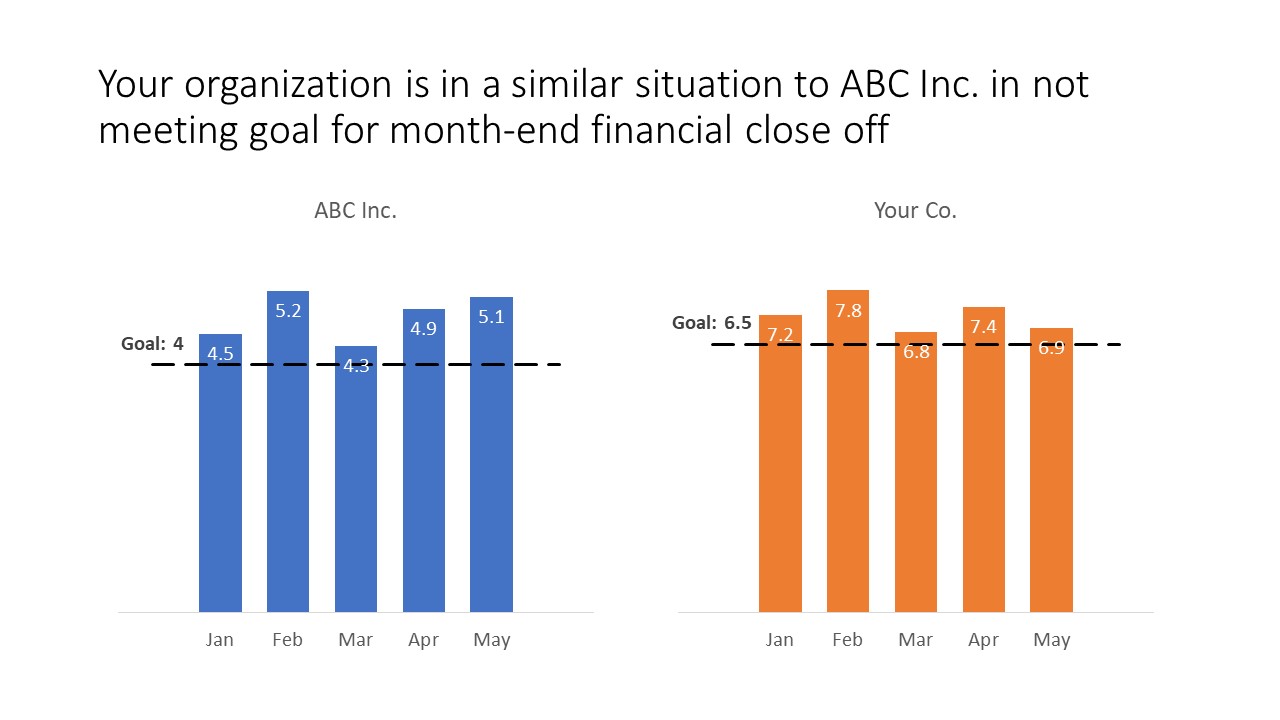
Step 1: Describe the problem and how it is similar
When you are describing the problem that your solution will solve, you need to show how this problem is similar to the one in the case study. If the problem is that results are not meeting a goal, a graph of the actual results vs. the goal in each situation may be an effective visual. If the problem is related to the failure of a piece of equipment, photos of the equipment in each situation can be an effective visual. It works best to have the two graphs or two photos on the same slide so the similarity is obvious. Here is an example.
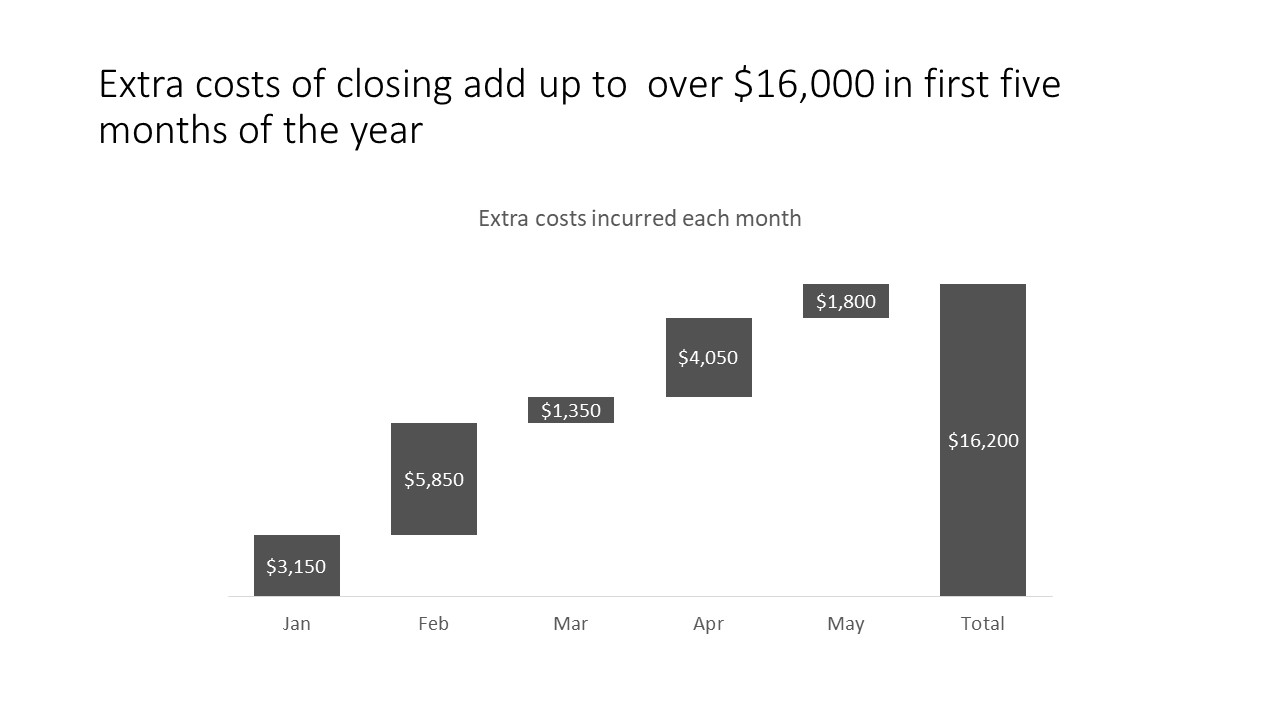
Step 2: Measure the size of the problem
We know only the problems causing enough pain in the organization get addressed. For this section, use a visual that will show the magnitude of the issue. A graph will likely be the best visual showing how the results are not meeting the desired values. Here is an example.
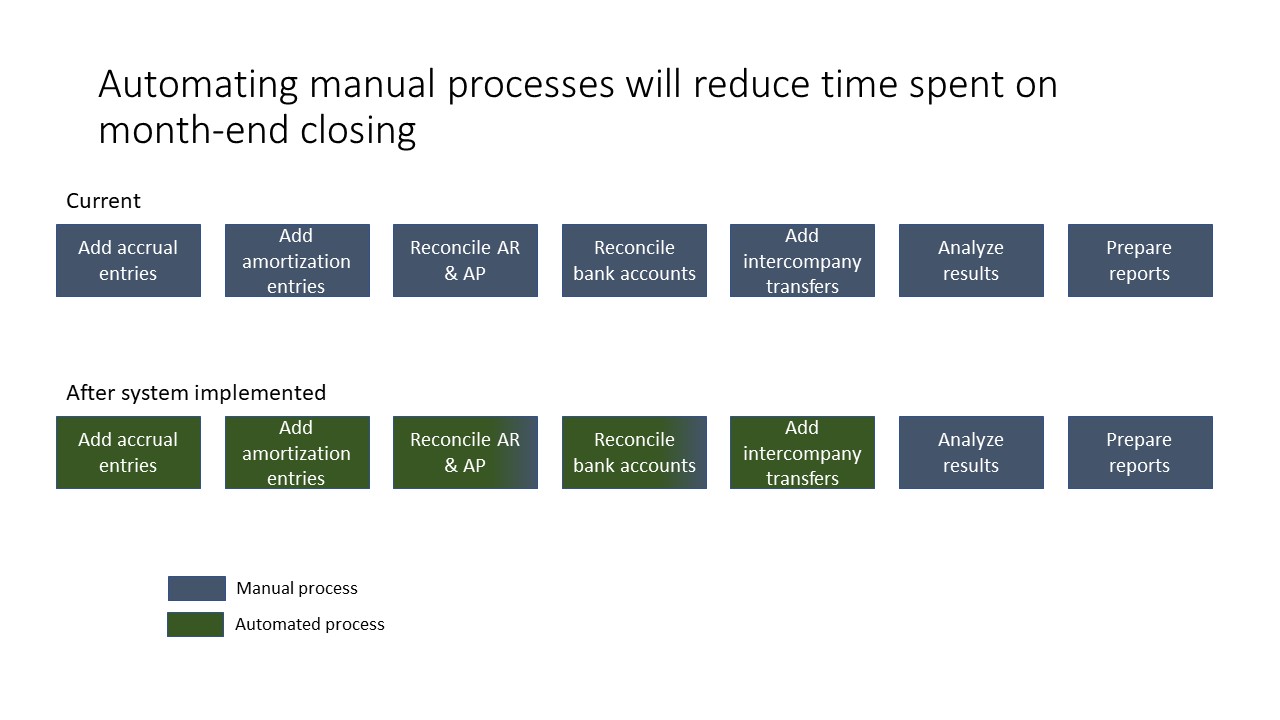
Step 3: Provide an overview of the solution
One of the reasons that you will use a case study is that the solution in the case study is similar to the solution being proposed. The solution may be a change in a process, which can be illustrated using a process diagram. The solution may be illustrated by images of what the solution will look like. The solution may be implemented on a schedule and a timeline visual may effectively illustrate the steps that are proposed. Consider adding visuals that show the solution in addition to any details of the solution you plan to explain. Here is an example.
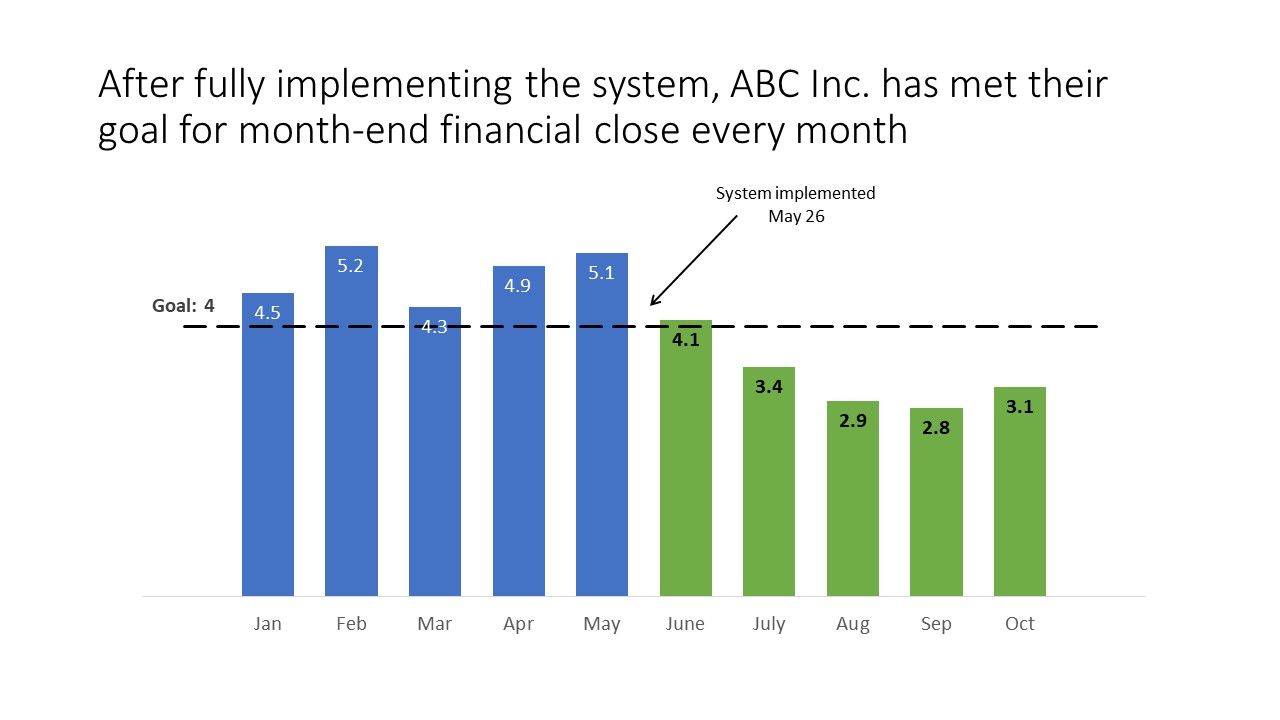
Step 4: Show the benefit of your solution
The benefit of the solution in the case study will be used to support why the investment in the proposed solution should be made. If possible, use a visual that illustrates the benefit in the same measurement (dollars, time saved, productivity, etc.) as the size of the problem in step 2. This may be a graph for numeric benefits, it could be a timeline that shows a reduction in time spent on a series of tasks, or it could be images that show an increase in quality or functionality. Here is an example.
If you decide to use a case study to support your message, structure the case study using these four steps and illustrate the steps with visuals that help the decision maker see that your proposed solution will solve the problem they are facing.

Dave Paradi has over twenty-two years of experience delivering customized training workshops to help business professionals improve their presentations. He has written ten books and over 600 articles on the topic of effective presentations and his ideas have appeared in publications around the world. His focus is on helping corporate professionals visually communicate the messages in their data so they don’t overwhelm and confuse executives. Dave is one of fewer than ten people in North America recognized by Microsoft with the Most Valuable Professional Award for his contributions to the Excel, PowerPoint, and Teams communities. His articles and videos on virtual presenting have been viewed over 4.8 million times and liked over 17,000 times on YouTube.