A recent consulting assignment was a good demonstration of the problem presenters run into when they confuse their message with the supporting information. My client was presenting to executives to suggest what they should do about a situation in one of their divisions.
The problem was that she had structured the presentation so it listed all of the analysis she had done first. She started by describing the current situation, then talked about the staffing issues, the problems with the capabilities of the systems, and what activities were measuring up to standard or not. Finally she gave the conclusion of what she felt they needed to do to address the problems. Lots of details in every section. She said this was her summary for the executives.
It was far from a summary. It was an overload of data. And the executives would have been overwhelmed and not taken any action. I worked with her to clarify what the key message was and what she wanted the executives to do in order to solve the problems. We presented the key recommendations first and then the selected backup data to prove the conclusions she had reached. After she delivered the presentation, she emailed me to let me know the executives had agreed with her recommendations and the presentation was a success.
What can all presenters learn from this situation? It goes back to some research that was published in the book Brain Rules by John Medina. The research found that when you structure a presentation with a long list of data before the conclusion, it is not effective for two reasons. First, as you are presenting the data, the audience doesn’t know whether the data supports the conclusion since they don’t know what the conclusion is. Second, when you get to the conclusion, the audience doesn’t know whether the data supports the conclusion because they can’t remember all the data. The research showed that by presenting the conclusion first, then the supporting data, the audience understands the message much better. So when you are structuring your presentation, present the conclusion first, then the data.
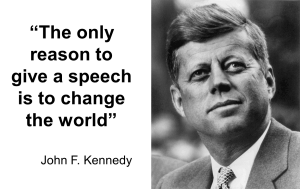
 In her book Resonate, Nancy Duarte quotes US President John F. Kennedy saying, “The only reason to give a speech is to change the world.” I think this applies to almost every presentation we deliver. We are trying to change some part of the world this presentation applies to. It can be as small as trying to change the way someone works in a manufacturing plant so it is done more safely. It can be as large as convincing investors that the company is on the right track with a new strategic direction. We are changing the world in some way.
The reason I bring up this quote is because I think it helps distinguish for us the two parts of our presentation. There is the change, and there are the reasons for the change. Your core message is the change you want the audience to make and the supporting data are the reasons for the change. Instead of the traditional approach of listing all the reasons before telling them what the change is, I suggest we start with the change, then the reasons why they should change. Start with the conclusion, then give the selected supporting data.
When you think about the structure of your presentation this way, you will create a more compelling presentation that will hold the audience’s attention and be more successful at making the change you want them to make.

Dave Paradi has over twenty-two years of experience delivering customized training workshops to help business professionals improve their presentations. He has written ten books and over 600 articles on the topic of effective presentations and his ideas have appeared in publications around the world. His focus is on helping corporate professionals visually communicate the messages in their data so they don’t overwhelm and confuse executives. Dave is one of fewer than ten people in North America recognized by Microsoft with the Most Valuable Professional Award for his contributions to the Excel, PowerPoint, and Teams communities. His articles and videos on virtual presenting have been viewed over 4.8 million times and liked over 17,000 times on YouTube.
