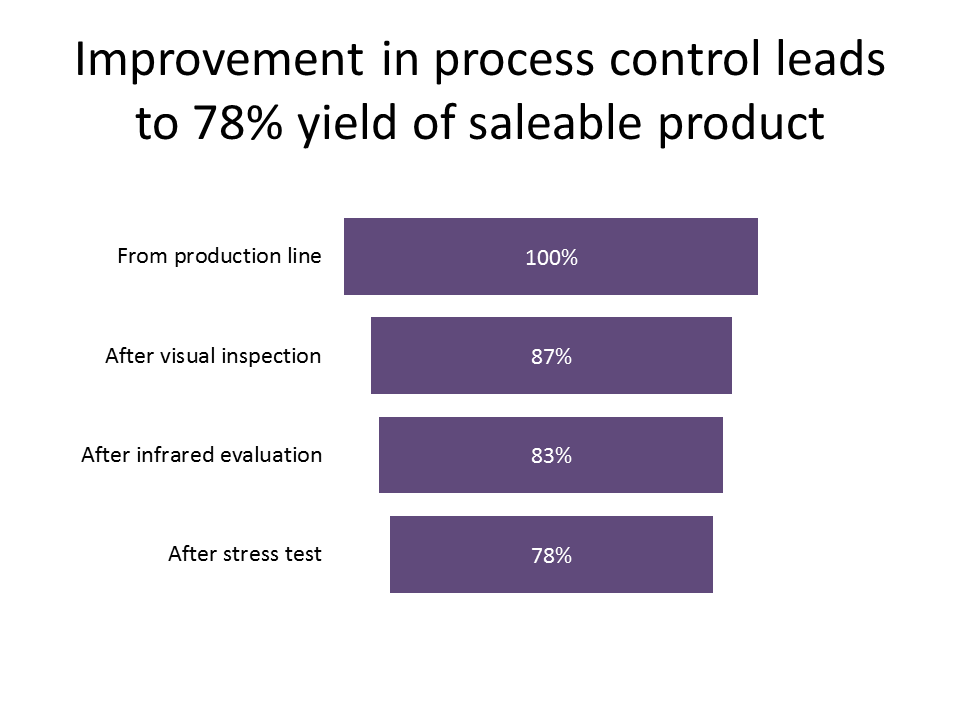
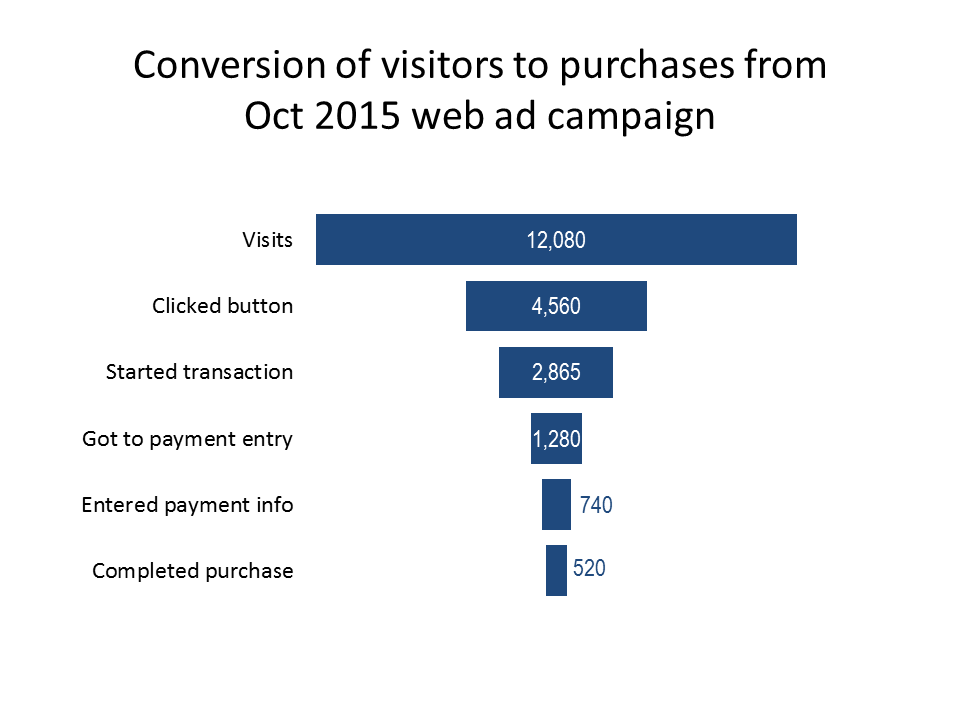
A funnel chart is a visual used to show how a starting amount is reduced or grows with each step in a process. It uses centered rectangles aligned vertically to represent the size of each value. Here are two examples.
A funnel chart is a new chart type introduced in February 2016 in the Office 365 version of PowerPoint and Excel. But it is easily created in any version of PowerPoint or Excel using a stacked bar chart where one segment is set to be invisible.
The calculator you can download below will allow you to input the labels and values for up to nine steps after the starting value. The calculator creates a Results table that you can use in Excel or PowerPoint. Just copy the results table into a stacked bar graph and set the spacer segments to be invisible. It is part of my Calculators For Visuals Excel file that you can download.
Right-click on this link and select to Save the file to your computer. Then open the file you have downloaded in Excel.


