Comparing actual spending to budgeted spending is an important topic in many presentations. Too often the actual and budget amounts are shown in a table and the audience is expected to subtract large numbers in order to understand the difference. My latest makeover demonstrates how you can use a diverging bar chart with explanations to show the relative difference across projects.
While actual and budget figures are typically shown as a large table (usually copied from a spreadsheet), the original slide used a graph.
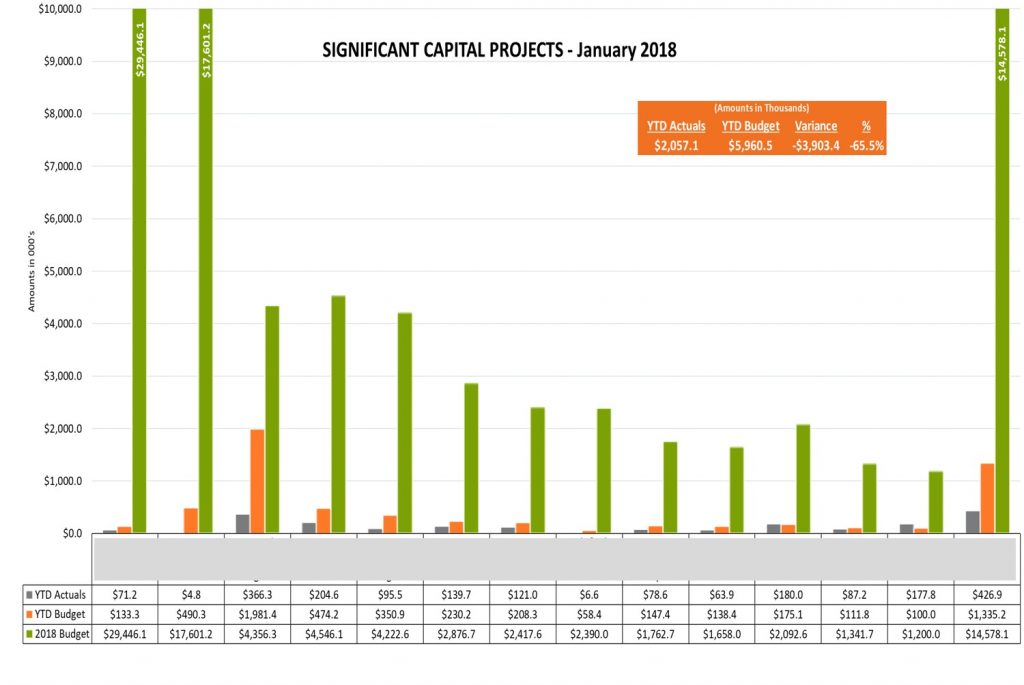
In this case, using a graph is no better than using a large table. The graph just shows the values in columns and actually makes it even harder for the audience because they have to figure out the value represented by each column before they do the math. That is so difficult that a table of numbers that duplicates the graph information is added but only clutters up the slide.
In the makeover slide I visually show the differences so that the audience can focus on the important message.
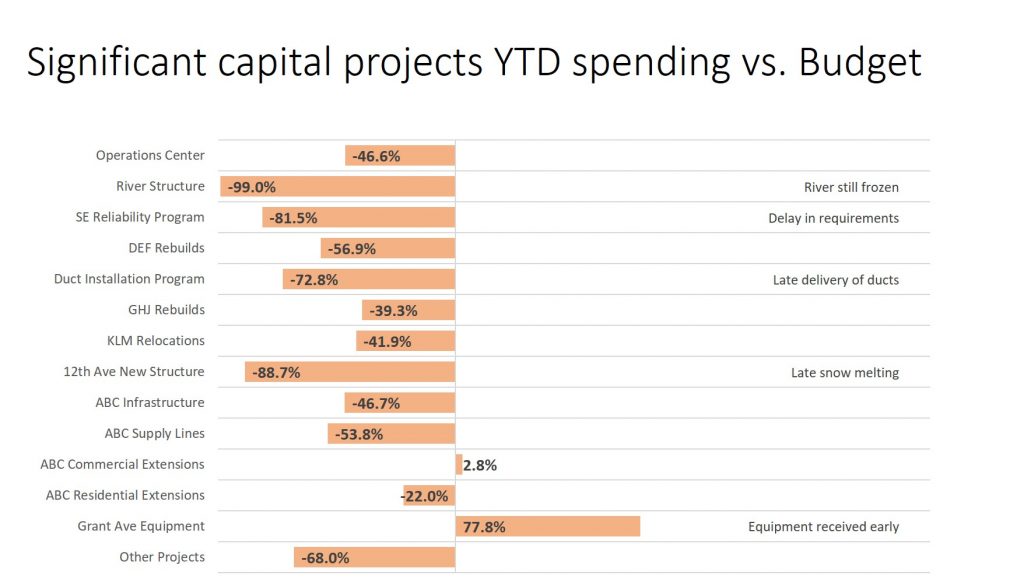
I’ve used a diverging bar chart here so it is easy for the audience to see which projects are under or over budget at this point in time. Instead of using the difference in dollars, I’ve graphed the difference in percentage. This relative difference better measures the progress of projects that have very different budget and actual spending amounts. Using percentage difference allows the audience to focus on the projects with the greatest difference to what was budgeted.
I’ve cleaned up the graph by replacing the horizontal measurement axis with data labels in each bar. This makes the graph easier to interpret for the audience. I’ve also added explanations to some of the bars to answer some questions that the audience is likely to have from viewing the graph. These explanations will be where the presenter will likely focus the discussion when presenting the slide.
The explanatory text is drawn from cells in the worksheet, not added using text boxes. This feature was added in Office 2013 and is one of the expert-level techniques I demonstrate in my new Excel Chart Skills 501 online course.
In the makeover video below you will see a more extensive explanation of the key changes I made and why I think they help the audience understand the message better.
When you are communicating the difference between actual and budget amounts, consider using a diverging bar chart with explanations instead of a table of numbers. It will help your audience focus on the message you want them to understand.

Dave Paradi has over twenty-two years of experience delivering customized training workshops to help business professionals improve their presentations. He has written ten books and over 600 articles on the topic of effective presentations and his ideas have appeared in publications around the world. His focus is on helping corporate professionals visually communicate the messages in their data so they don’t overwhelm and confuse executives. Dave is one of fewer than ten people in North America recognized by Microsoft with the Most Valuable Professional Award for his contributions to the Excel, PowerPoint, and Teams communities. His articles and videos on virtual presenting have been viewed over 4.8 million times and liked over 17,000 times on YouTube.