How do you choose the right chart to report results or analysis? Don’t select a chart or graph just because it looks cool or pretty. In this video I share the two big issues with putting spreadsheets on slides, the three reasons business professionals put spreadsheets on slides, and introduce a structured way to identify visuals that communicate the message you want the audience to understand.
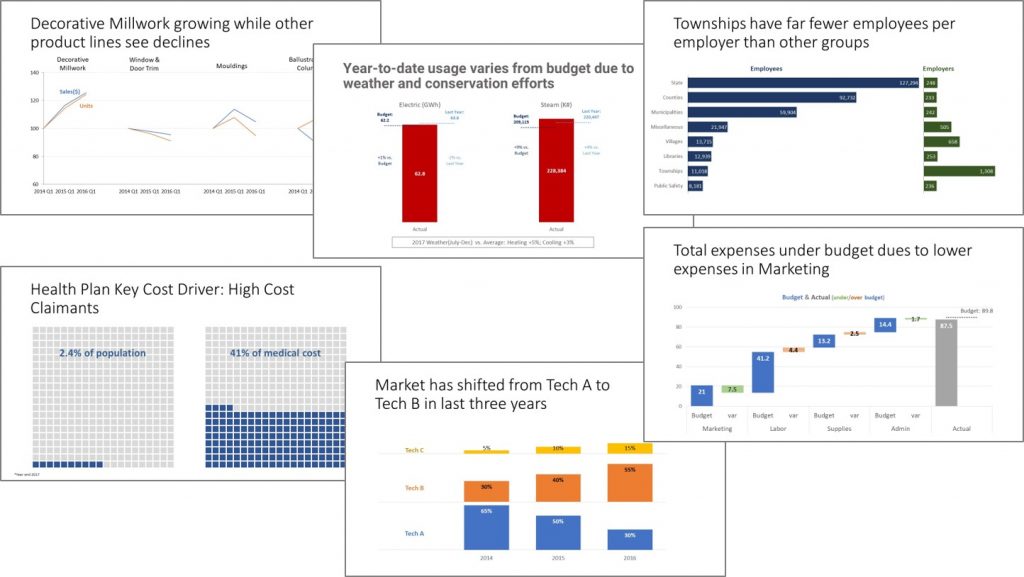
Want to learn more about selecting the right chart in Excel? The FinancialViz Message-based Data viz Chooser is a structured approach to selecting visuals for financial results and analysis. It is designed for business professionals who are skilled at their jobs and want to improve the effectiveness of their presentations by using data visuals instead of spreadsheets. It is for those who don’t want to have to learn new tools or programming languages and want to be able to use Excel and PowerPoint, the tools they are already familiar with. Click on the image below to learn more.

Dave Paradi has over twenty-two years of experience delivering customized training workshops to help business professionals improve their presentations. He has written ten books and over 600 articles on the topic of effective presentations and his ideas have appeared in publications around the world. His focus is on helping corporate professionals visually communicate the messages in their data so they don’t overwhelm and confuse executives. Dave is one of fewer than ten people in North America recognized by Microsoft with the Most Valuable Professional Award for his contributions to the Excel, PowerPoint, and Teams communities. His articles and videos on virtual presenting have been viewed over 4.8 million times and liked over 17,000 times on YouTube.