FinancialViz Online Courses
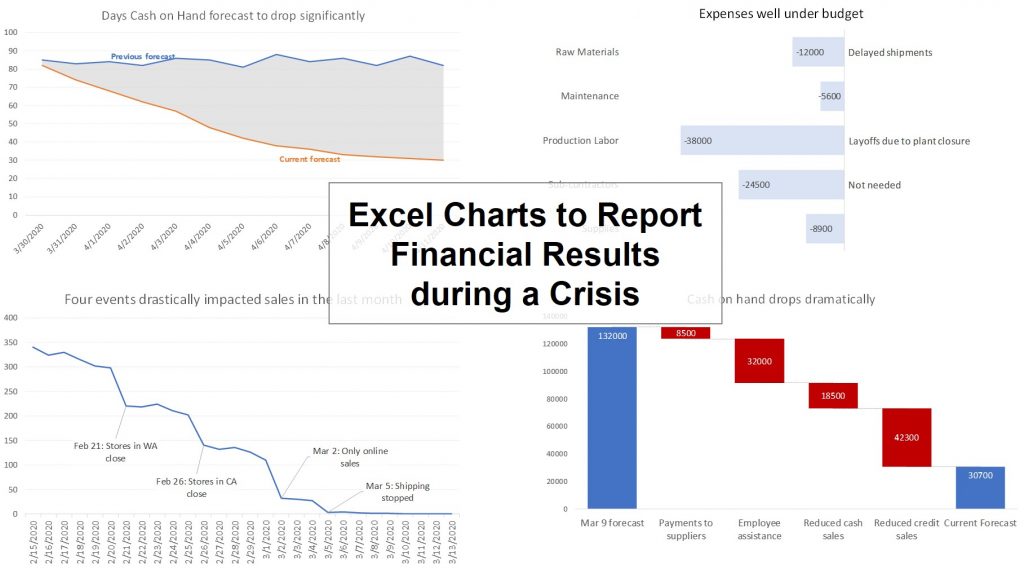
Excel Charts to Report Financial Results during a Crisis
Get a downloadable template and complete instructions on how to create visuals in Excel that communicate critical financial metrics in a crisis.
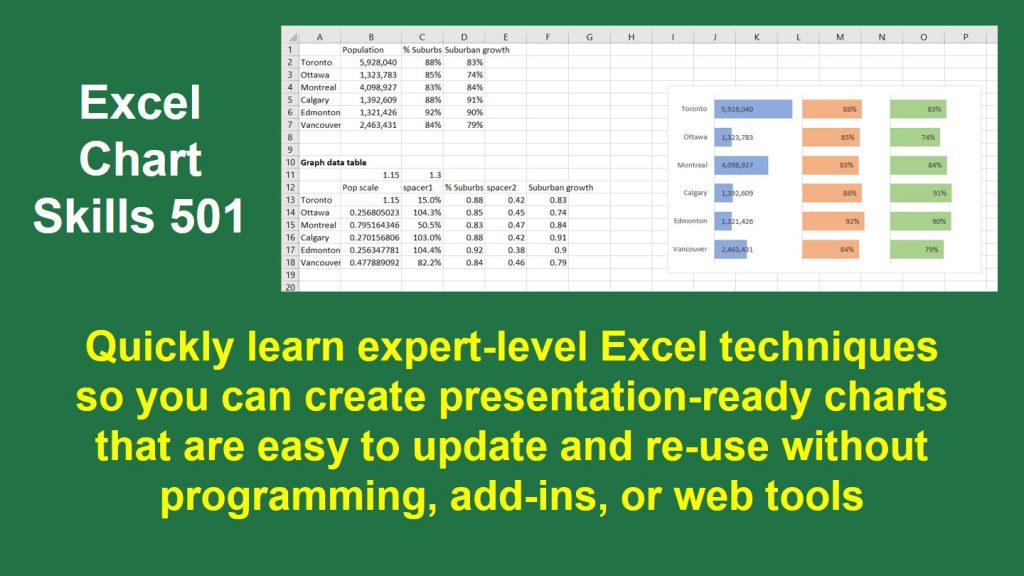
Excel Chart Skills 501
Quickly learn expert-level Excel techniques so you can create presentation-ready charts that are easy to update and re-use without programming, add-ins, or web tools
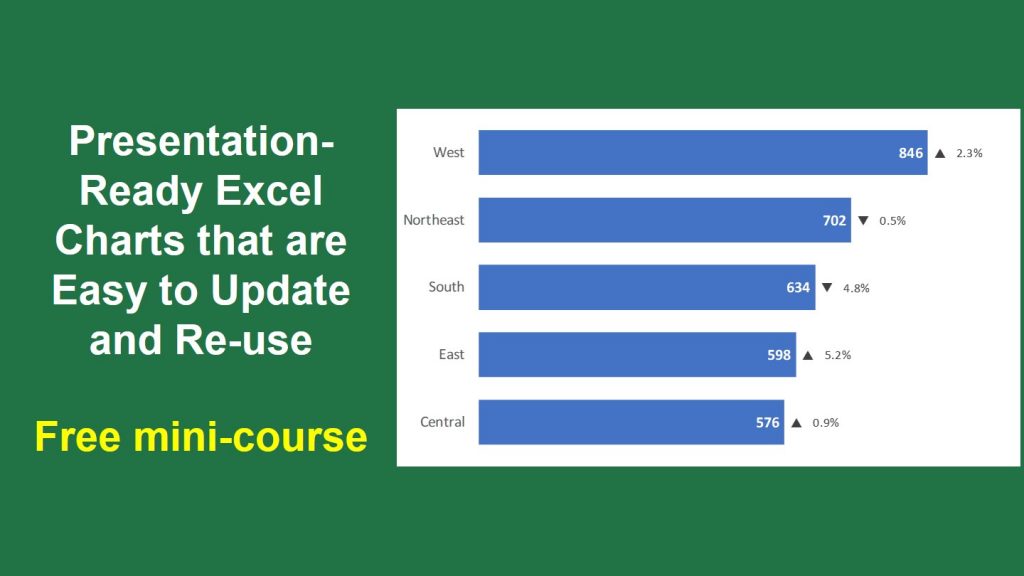
Presentation-Ready Excel Charts that are Easy to Update and Re-use
Spend less time creating and updating Excel charts for business presentations with these practical tips.
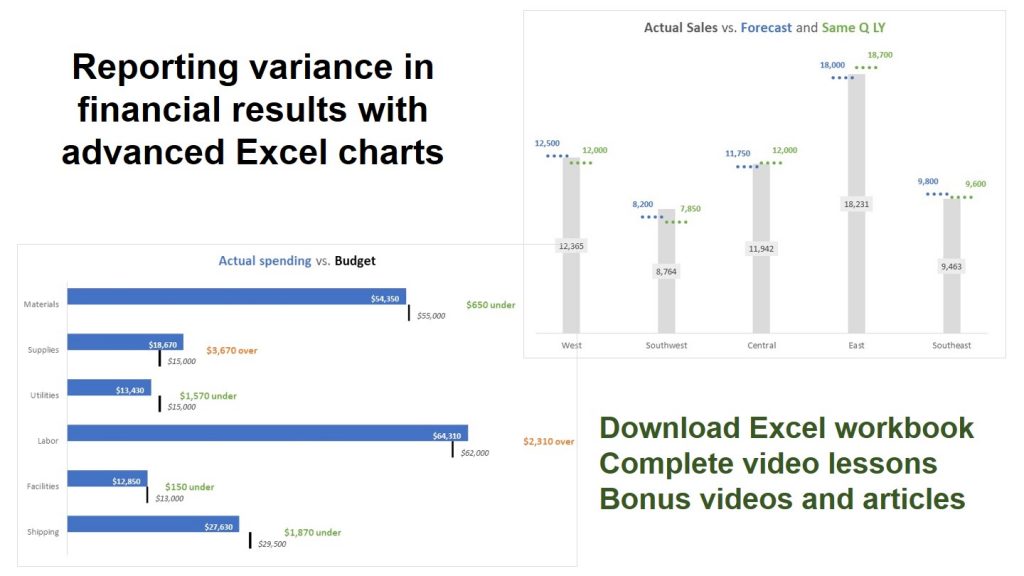
Reporting variance in financial results with advanced Excel charts
Get a downloadable template and complete instructions on how to create six visuals in Excel that communicate variance between actual results and budget, forecast, or last year.
FinancialViz Message-Based Dataviz Chooser
Choose the right visual for financial results and analysis based on the message you want to communicate.