A few years ago I shared an approach that you can use to extract data from an Excel chart that won’t allow you to view or edit the data. This happens when a chart is pasted from Excel onto a slide using the normal Ctrl+V paste method. The data is linked back to the Excel file. This makes updating the chart easy when the data changes. But it leaves the data inaccessible if the Excel file is on another computer or moves to a new location.
The previous method used Acrobat Reader and required additional work to get the data into the correct cells in Excel. I recently watched a video from Taylor at Nuts and Bolts PowerPoint that demonstrates Word’s ability to convert tables in PDF files. I recently had to extract data for a number of makeovers I was doing for a customized training program and I developed a new approach that uses PowerPoint and Word to extract the data from a linked Excel chart into a properly formatted set of cells in Excel. Here’s what you can do if you can’t view or edit the data in a linked Excel chart.
Step 1: Copy the chart to a new file
Copy the chart and paste it into a new blank template PowerPoint file. You need a single slide clean PowerPoint file for this method to work. Don’t use your corporate template because it may have text or shading in the background.
Step 2: Format the chart with a data table below
Make the chart larger on the slide so the values will fit in the data table. Remove the legend and the vertical axis so that there is no extra text where the data table will be. Add a data table to the chart object so the data is shown below the chart. Select the option to not have legend keys in the data table. I also suggest you choose a font that has mono-spaced numbers, like Calibri, for the data table as it usually gives better results when converting numbers formatted with commas or periods. You should have a chart that looks like this with a clean table of data below the chart.

Step 3: Create a PNG image of the table
Copy the chart. On a new blank slide (it could be in a new file if you want), use the Paste Special option to paste it as a PNG image. Don’t select any other type of image, use the PNG image type. Crop the image so just the table of numbers is shown on the slide. It will look like this.

Step 4: Create a PDF file
The PDF file you create must only have one slide and that slide must have the PNG table image from Step 3. You can delete all other slides from the one file you are working in or you can copy the one slide with the PNG table to a new PowerPoint file. Save the single slide file as a PDF using the Save as feature in PowerPoint.
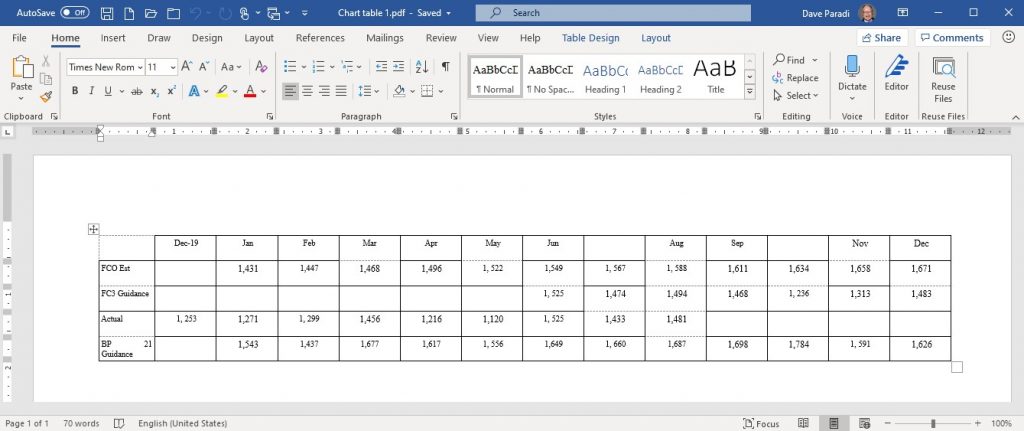
Step 5: Open the PDF file and convert it in Word
Start Word and create a new blank document. Open the PDF file you saved in Step 4 and let Word convert it to a Word document. It should create a Word table. You can check by clicking in the table and checking that the Table Design and Layout ribbons appear.
Step 6: Copy the data to Excel
Copy the cell contents by selecting all the content in the cells in the Word table. Press Ctrl+C to copy the selection. Go to the Excel worksheet you want the data to be in. Select to Paste the text using the Match Destination Formatting option so that the text is pasted in without the formatting from Word.
Step 7: Verify the data in Excel
Check the cells to verify that the content was copied in correctly. Sometimes there will be a cell where there is no data or a heading is missing. Add those in based on the table image in step 3. Occasionally numbers formatted with a comma or decimal place may have a space added after the comma or period. This causes Excel to interpret them as text, not as numbers. These cells will have the number left aligned like text instead of right aligned like a number. Edit the cells to remove the extra space and Excel will now interpret the values as numbers. If you want, you can use the NUMBERVALUE function in Excel to convert all of the cells (whether they are numbers or text) to plain numbers. Save your Excel file with the data from the chart.
This method can save you hours of manual effort retyping chart data and can save you when a file you had access to in the past gets moved or deleted.
I’ve created a video of these steps so you can see how this is done and follow along on your own computer.

Dave Paradi has over twenty-two years of experience delivering customized training workshops to help business professionals improve their presentations. He has written ten books and over 600 articles on the topic of effective presentations and his ideas have appeared in publications around the world. His focus is on helping corporate professionals visually communicate the messages in their data so they don’t overwhelm and confuse executives. Dave is one of fewer than ten people in North America recognized by Microsoft with the Most Valuable Professional Award for his contributions to the Excel, PowerPoint, and Teams communities. His articles and videos on virtual presenting have been viewed over 4.8 million times and liked over 17,000 times on YouTube.