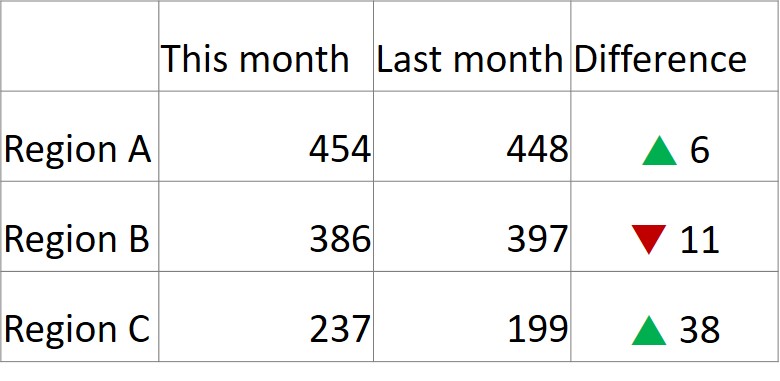
Excel has a great feature called conditional formatting that can save you time in making the results of analysis more visual. In particular, Excel can automatically add an up or down triangle to cells depending on their value. This makes reporting on the difference between a current and previous period value more visual. Here is an example:
There are a couple of issues with conditional formatting that can make it problematic for presentations. First, you will notice that the down triangle is beside a negative number. The triangle direction is set based on whether the difference is above or below zero. The problem is that a down triangle with a negative number may be interpreted as a double negative by some audience members.
The second issue is that when you copy these cells from Excel to PowerPoint, the conditional formatting will only show up if you copy the cells as a picture. If you copy the cells using the default copy and paste so that you can format the cells or edit them in PowerPoint, you just get the values, the up or down triangles are not copied.
There is an alternative that allows you to have the indicator characters and edit or format the cells in PowerPoint. You can create cells in Excel that contain the characters and values you need in PowerPoint. This technique relies on knowing what font contains the triangles and which character in a regular font will translate to the triangles when you switch the font.
The Wingdings3 font contains the up and down pointing triangles. In a regular font, the up triangle is the lower case letter “p” and the down triangle is the lower case letter “q”. We can create a formula in Excel that creates a text cell containing the indicator character and the value without a negative sign. Here is an example of the formula:
This formula examines the value in cell D4, one of the cells that contains the calculated difference between the current and previous period values. For completeness, the formula starts by assigning a short dash if the difference is zero. If the difference is not zero, we check if it is above zero. If it is, we create a text string containing the lower case p, a space, then the absolute value of the number in cell D4. Similarly, if the value is below zero, we create a text string including the lower case q and the absolute value of the number, which eliminates the negative sign. The table will look like this.
We can now copy this table to a PowerPoint slide using the default copy and paste. This gives us a PowerPoint table that can be edited and formatted. PowerPoint allows different fonts for individual characters in a table cell or text box, which Excel does not. We change the lower case p or q to the Wingdings3 font, which changes these characters to the up or down triangle. Because these are characters, we can also change the font color and we can change the alignment of the text in the table cell. We can quickly and easily create the following PowerPoint table on the slide.
If you use conditional formatting in Excel and want to have editable tables you can format in PowerPoint, consider this technique for showing the direction and value of differences.

Dave Paradi has over twenty-two years of experience delivering customized training workshops to help business professionals improve their presentations. He has written ten books and over 600 articles on the topic of effective presentations and his ideas have appeared in publications around the world. His focus is on helping corporate professionals visually communicate the messages in their data so they don’t overwhelm and confuse executives. Dave is one of fewer than ten people in North America recognized by Microsoft with the Most Valuable Professional Award for his contributions to the Excel, PowerPoint, and Teams communities. His articles and videos on virtual presenting have been viewed over 4.8 million times and liked over 17,000 times on YouTube.


