One of the categories of visuals I discuss in my book Select Effective Visuals is showing a relationship of sequence. If your message is about a sequence of steps in a process or how a vendor and customer contribute to reaching an end goal, this category of visuals will help you show your message to the audience.
One of the specific sub-groups in this category is for a sequence that has a single linear path. Often a chevron diagram works well, or a set of shapes with arrows between them will work. The challenge comes when you either have more than a few steps or the descriptive text for each step is long. Often presenters run out of room at the right side of the slide and end up wrapping the linear path around to start again on a second line. This makes it hard for the audience to follow the steps.
I often show a slightly different visual that can help keep the linear sequence on one line for these situations. I call it a Shapes on an arrow diagram. Here is one based on a slide makeover in a recent customized workshop:
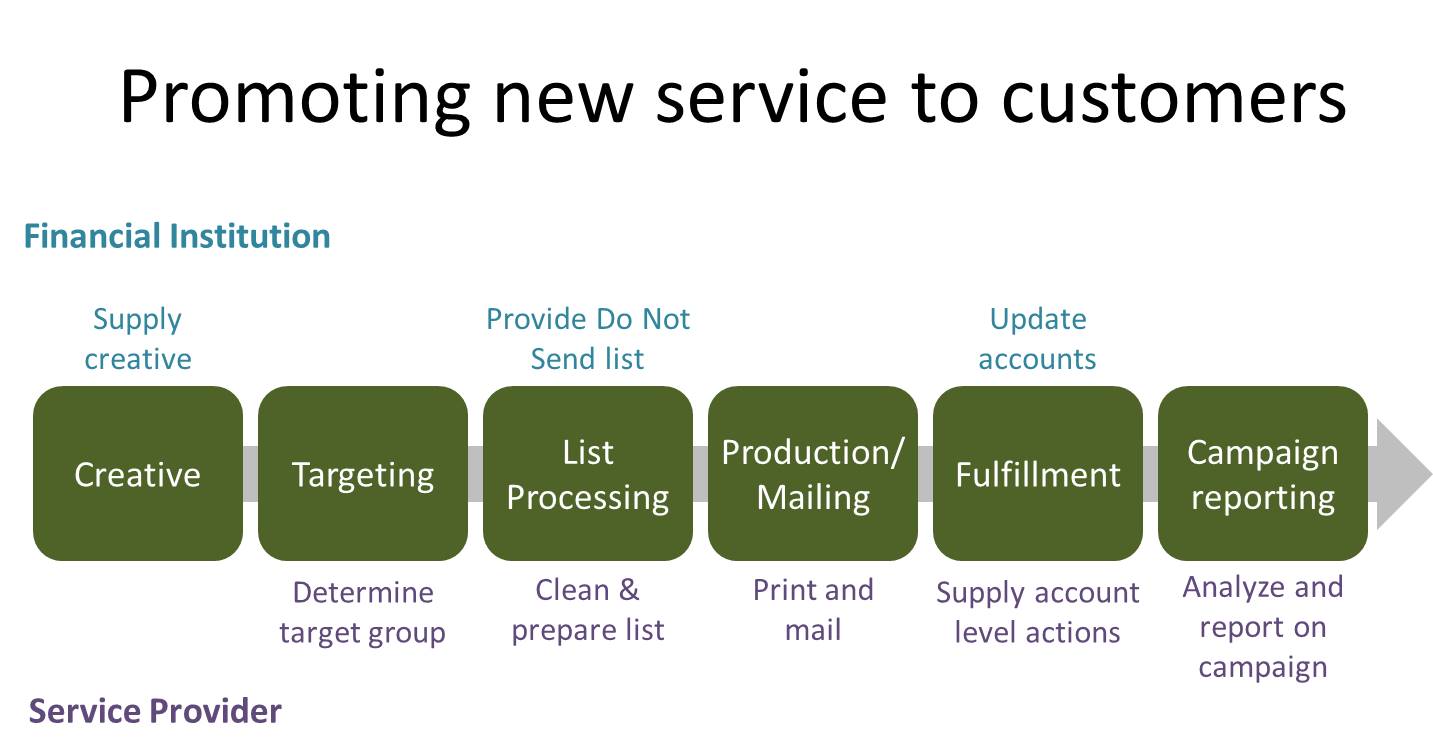
What makes this visual work well is that the direction of the sequence is visualized using an arrow behind the shapes used for each step. This way, the shapes can be larger if you need more text, or closer together if you need more steps.
In creating this type of visual, I suggest you make the arrow behind a muted color, like a medium gray. It should be visible, but not take the focus away from the steps you want to discuss. Use shapes like rectangles or rounded rectangles that allow you to fit the required text inside. If the text almost fits but one letter wraps to the next line, use the text box margins trick I explained in this article. To arrange the shapes on top of each other, use the Selection & Visibility Pane that I described in this article. To make sure all of the shapes line up properly, use the Align & Distribute tools in PowerPoint (click here for tutorials on using these tools: Align in PPt 2013/2016/Office 365, Align in PPt 2010, Distribute in PPt 2013/2016/Office 365, Distribute in PPt 2010).
I also suggest you build these visuals using the shapes in PowerPoint instead of the SmartArt visual called a Continual Block Process (I explain why shapes work better than SmartArt in this article). By building this visual with shapes, you can animate the visual to bring each step on one-at-a-time, giving you the opportunity to discuss each step without the audience looking ahead to the other steps.
When you have a sequence that you want to explain in your presentation, choose a visual over a numbered or bulleted list. If you need more space for explanatory text or there are more steps to include, try the Shapes on an arrow diagram to keep the linear sequence to a single line.

Dave Paradi has over twenty-two years of experience delivering customized training workshops to help business professionals improve their presentations. He has written ten books and over 600 articles on the topic of effective presentations and his ideas have appeared in publications around the world. His focus is on helping corporate professionals visually communicate the messages in their data so they don’t overwhelm and confuse executives. Dave is one of fewer than ten people in North America recognized by Microsoft with the Most Valuable Professional Award for his contributions to the Excel, PowerPoint, and Teams communities. His articles and videos on virtual presenting have been viewed over 4.8 million times and liked over 17,000 times on YouTube.