One of the categories of messages that I discuss in my book Select Effective Visuals is a relationship over time. Whenever you are creating a visual that represents time periods, it is important that the time periods be accurately represented. If the time periods, such as months, are not all the same size, it can result in the audience misinterpreting the message you want to communicate.
In the past, I taught how to use the Align and Distribute functions in PowerPoint to create a properly spaced timeline. You can see these techniques in this video. Now I teach how to create timelines using a table, since it is much easier. Tables automatically distribute the columns evenly. If you ever accidentally move a column divider, there is a button on the Table Tools Layout ribbon that allows you to quickly distribute the columns evenly again.
I am always looking for ways to make creating effective visuals easy for presenters. In my customized workshops I often hear that presenters use a slide full of text or a spreadsheet because they think it will take too long to create a visual. Once they find out how to create effective visuals quickly and easily, they choose visuals over the text or spreadsheet. Earlier this year I realized that I could help make using timelines and calendars easier for presenters.
I have created three files of pre-made slides that save you the time of creating timelines and calendars on your own. Each visual is built using a table, so it is easy to use and fix if you accidentally mess it up. Each file contains instructions on how to use the visuals on the slides in that file.
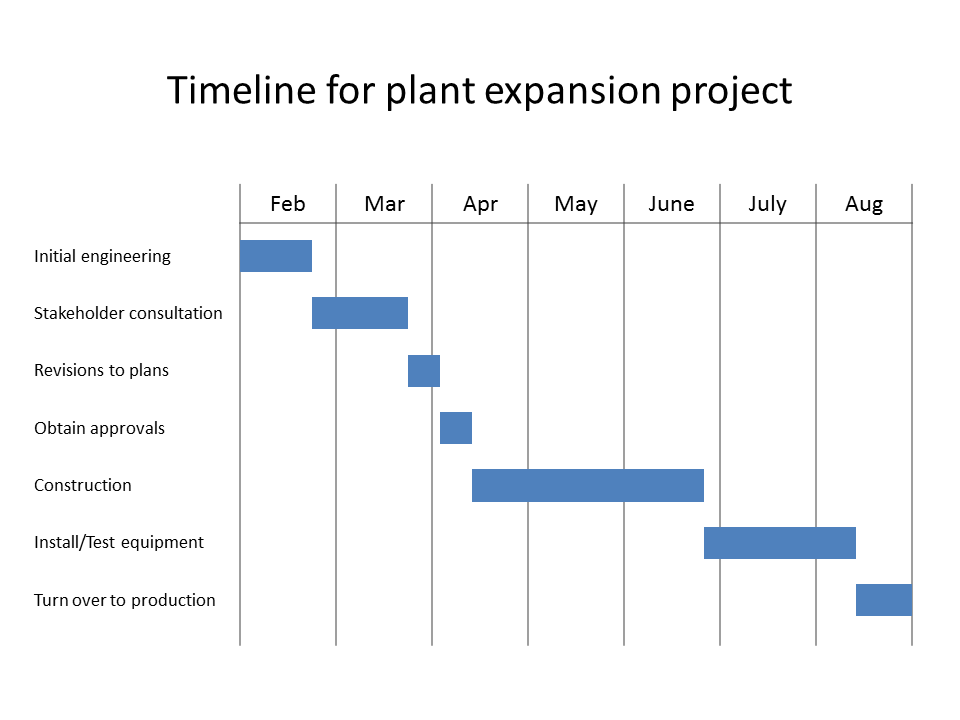
File #1 contains timelines for 2-24 time periods. These visuals will most likely be used to create Gantt charts of tasks over a certain number of months, or timelines of when events occur over a certain number of days or months. Here are examples of slides created using the visuals in this file.
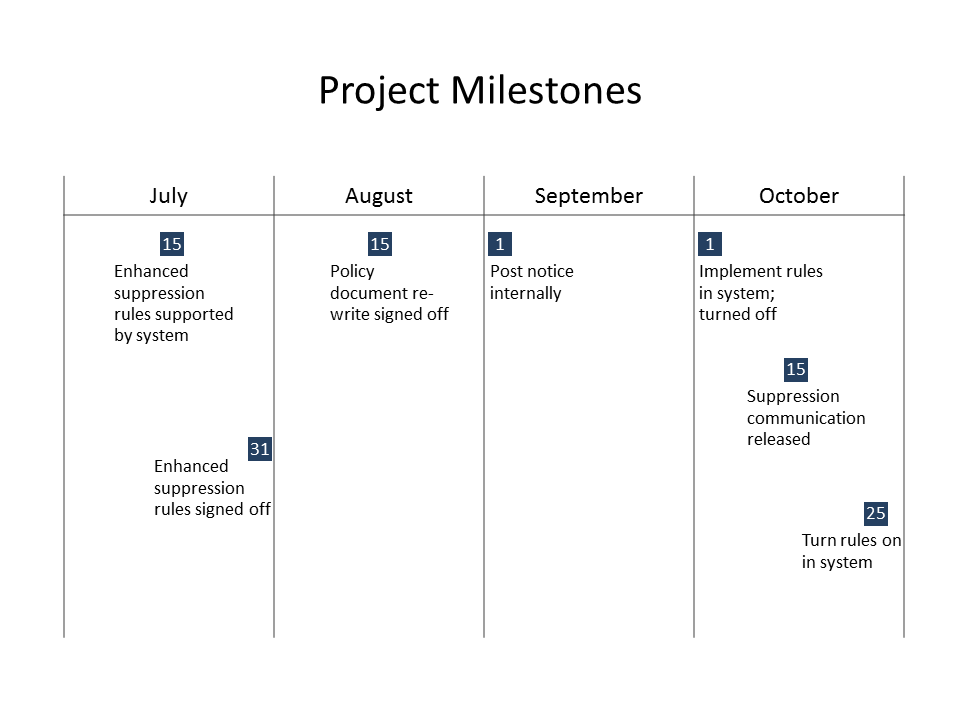
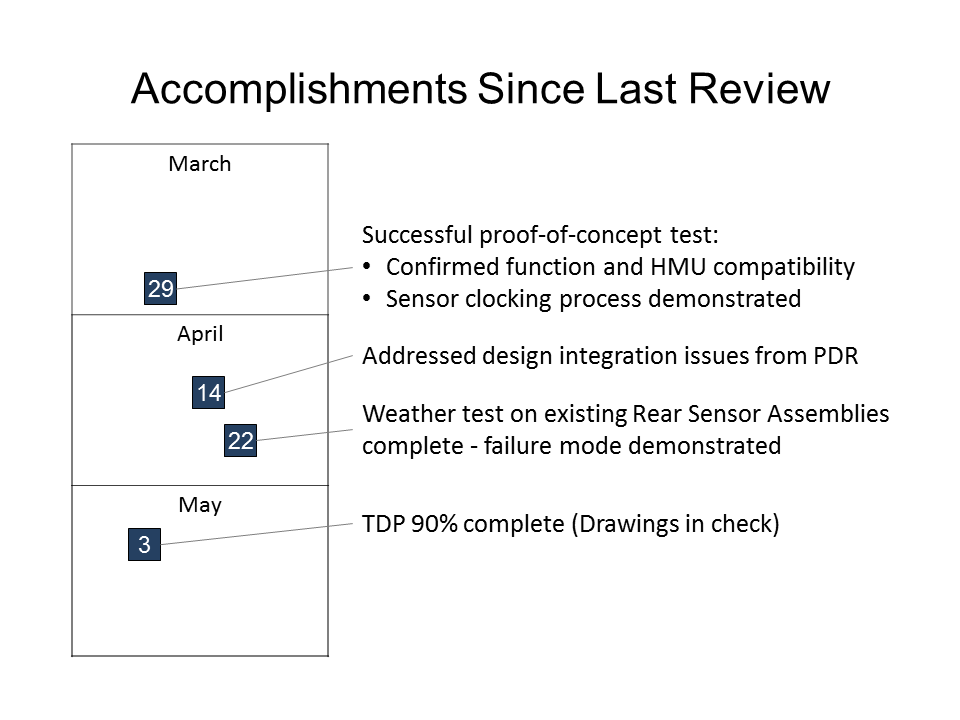
File #2 contains calendars with a rectangle for each month for 2-12 months. These visuals can be used to create a calendar of events where the events occur over a span of a few months or occur on an annual frequency. Here is an example of a slide created using a visual in this file.
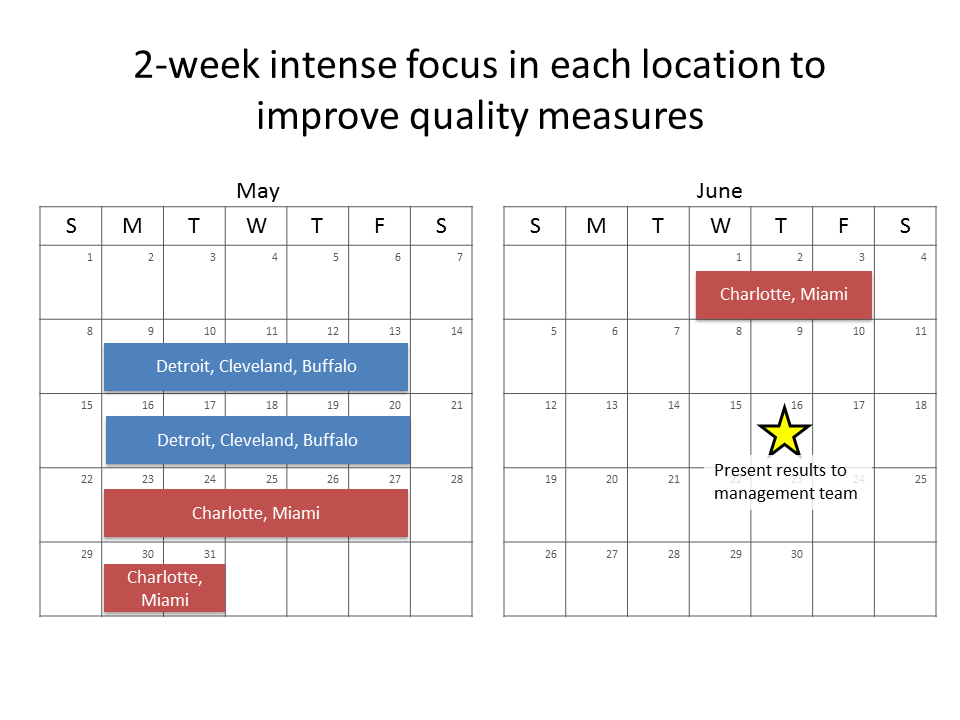
File #3 contains days of the month calendars for all possible months. The week starts on Sunday and ends on Saturday but can easily be changed. These visuals can be used to create a calendar of events where the events occur within a one or two month time period. Here is an example of a slide created using a visual in this file.
Download the one you need for the presentation you are working on, or download all three to keep as a starting point for future presentations. There are a total of 77 visuals in the three files. You can directly download the files at TimeSlides.com. There is no registration or email address required to download the files. Feel welcome to let others in your organization know that these files are available.

Dave Paradi has over twenty-two years of experience delivering customized training workshops to help business professionals improve their presentations. He has written ten books and over 600 articles on the topic of effective presentations and his ideas have appeared in publications around the world. His focus is on helping corporate professionals visually communicate the messages in their data so they don’t overwhelm and confuse executives. Dave is one of fewer than ten people in North America recognized by Microsoft with the Most Valuable Professional Award for his contributions to the Excel, PowerPoint, and Teams communities. His articles and videos on virtual presenting have been viewed over 4.8 million times and liked over 17,000 times on YouTube.