When I work on the slide makeovers for my customized workshops, I often run into graphs that can be formatted in PowerPoint, but the data can’t be accessed. This is common because when you use the default paste (Ctrl+V) to paste an Excel graph into PowerPoint, you get a graph that has the data linked back to the source Excel spreadsheet.
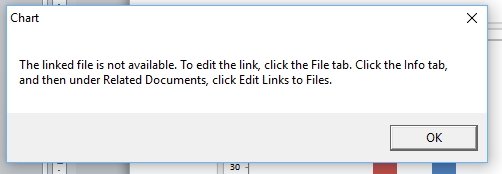
The advantage is that you can quickly access all the data and calculations by opening the Excel spreadsheet from PowerPoint. The problem is that if you don’t have access to the spreadsheet, because you are not connected to the Internet or you don’t have permission to access the location, you can’t access the data. You will see a message like this when you try to edit the data for the graph in PowerPoint.
This recently came up on a mailing list for Excel MVPs that I am subscribed to. The question was how to extract the data from the graph when you can’t access the spreadsheet. I wanted to share the answer I gave in hopes that it may help you if you find yourself in this situation.
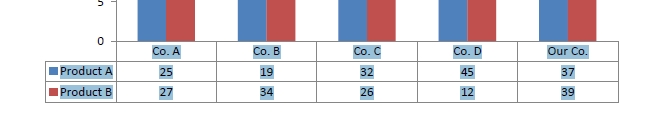
One of the options in formatting a PowerPoint graph is to add a table of data below the graph. In the Data Table option, select Show Data Table with Legend Keys so it is easier to identify the data later. To display all of the data you may have to set the font to be very small and/or use the Arial Narrow font so that all the decimal places are shown (you can change the font of the data table by selecting the data table and using the font face and point size settings). Here is a graph with the data table added:

Next, save the slide as a PDF file. You can use the PowerPoint Save As function and select the PDF file format. Save just this one slide or the entire file. Open the PDF file in Acrobat (the Reader will work, you don’t need the full version) and go to the slide with the graph. Acrobat knows this is text, so you can select it. Highlight the text in the table and press Ctrl+C to copy it.
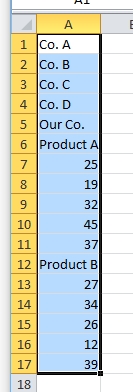
Paste the data into Excel. It usually pastes the data as a single column of values as shown below, so just move the values into the columns and rows as required.
Now you can use the data as needed to create a new graph or perform different calculations. Remember this method next time you receive a PowerPoint file that has a graph linked to a source Excel spreadsheet.

Dave Paradi has over twenty-two years of experience delivering customized training workshops to help business professionals improve their presentations. He has written ten books and over 600 articles on the topic of effective presentations and his ideas have appeared in publications around the world. His focus is on helping corporate professionals visually communicate the messages in their data so they don’t overwhelm and confuse executives. Dave is one of fewer than ten people in North America recognized by Microsoft with the Most Valuable Professional Award for his contributions to the Excel, PowerPoint, and Teams communities. His articles and videos on virtual presenting have been viewed over 4.8 million times and liked over 17,000 times on YouTube.